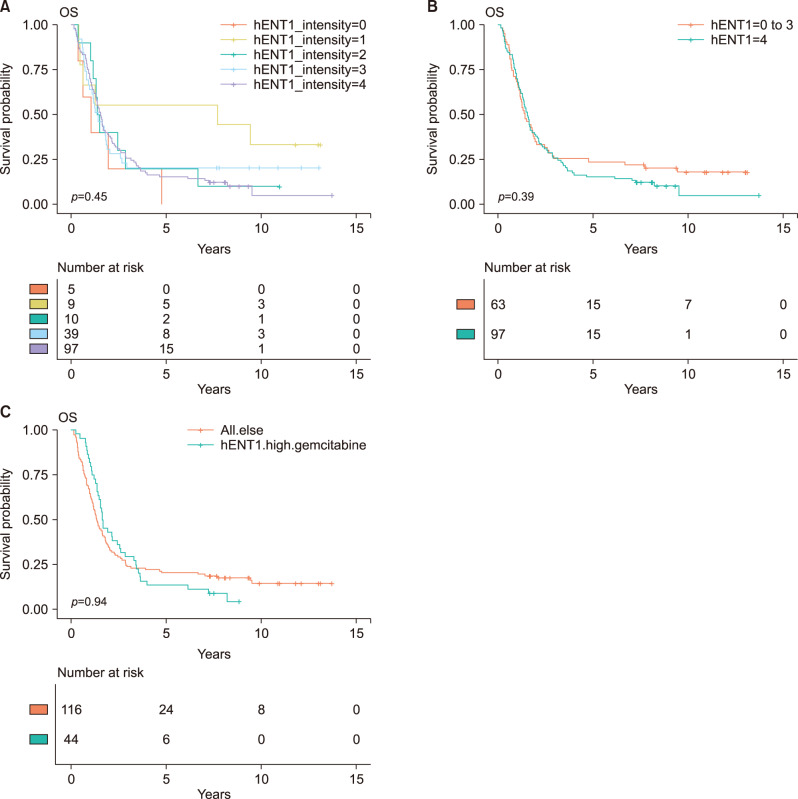
Fig. 1.
Kaplan-Meier survival curves. (A) Comparison of overall survival based on intensity of intratumoral hENT1 expression. There was no significant difference in overall survival. (B) High hENT1 expression group was compared with low hENT1 expression group, there was no statistical survival difference (HR, 1.16; 95% CI, 0.82-1.65, p=0.396). (C) When the group with gemcitabine therapy and high hENT1 expression was compared with all other patients, and no difference in overall survival was identified (HR, 0.99; 95% CI, 0.68-1.42; p=0.940).

