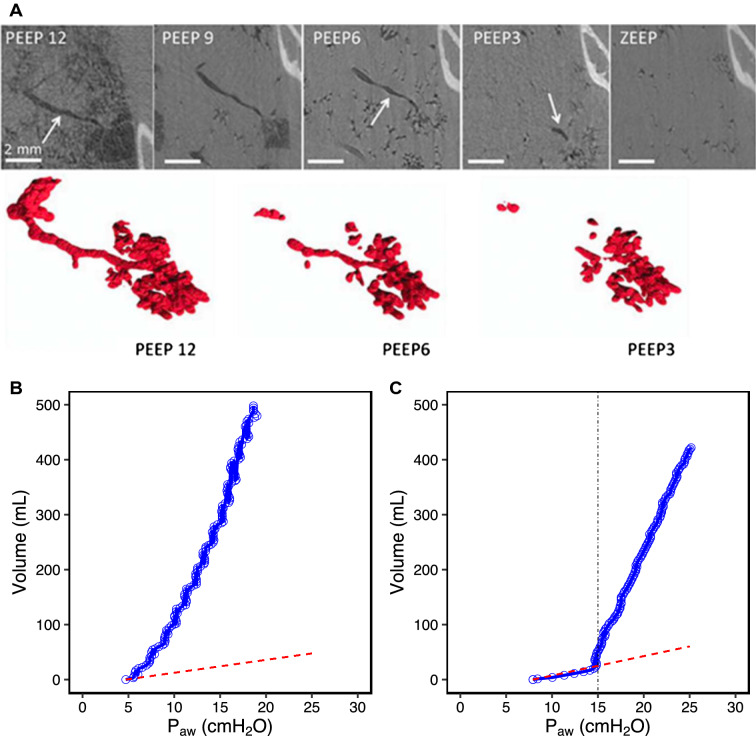
Fig. 1.
a Study of airway closure in a rabbit whole-lung lavage and injurious ventilation model, using synchrotron radiation technique. The image is an iso-gravitational cut through the lung with the rabbit in an upright position. Note that small airways, 18th of 21 generations, are open when PEEP is 12 cm H2O, but begin to close with PEEP 6 and that most small airways are closed at PEEP 3. Alveoli remain open but it may be anticipated that they close after some time, in particular if ventilation is with 100% oxygen [7]. b Low-flow inflation pressure–volume (P–V) curve from a patient without complete airway closure. P–V curve of the patient (blue) and the occluded circuit (red) separate immediately and cardiac oscillations can be seen throughout the whole P–V curve [13]. c Low-flow inflation P–V curve from a patient with complete airway closure. P–V curve of the patient (blue) superimposed to that of the occluded circuit (red) until airway pressure exceeded a critical level—airway opening pressure (black line at 15 cm H2O). After this, cardiac oscillations can be seen on the P–V curve [13]

