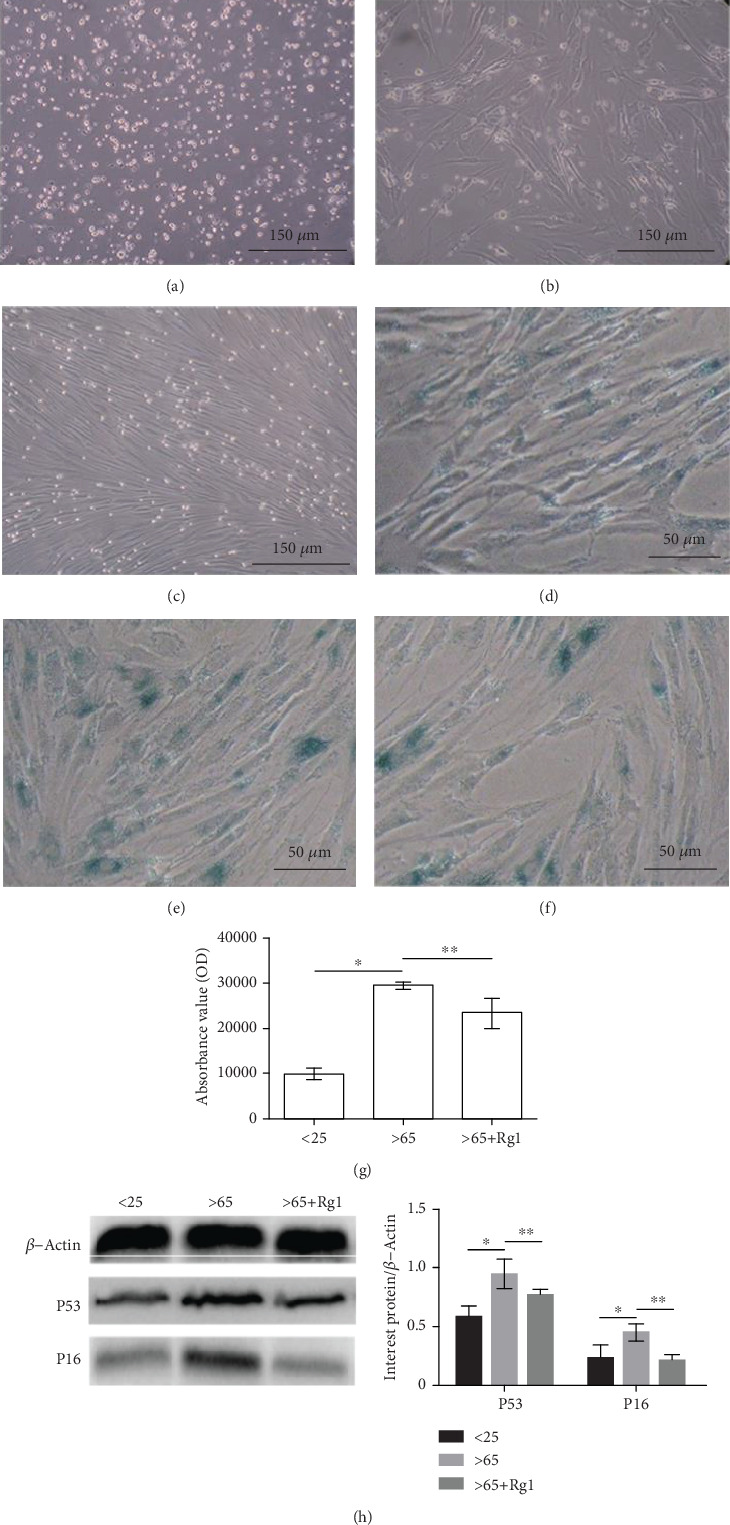
Figure 4.

Effect of Rg1 on the senescence and morphology of hBM-MSCs. The cell morphology was observed at (a) 24 h and (b) 72 h and (c) cultured cells to the third generation after isolation. SA-β-gal was used to mark the aging cells the cytoplasm of positive cells was stained blue, (d) <25 years old, (e) >65 years old, and (f) >65+Rg1. This test was repeated three times. Representative images were shown. The ROD value was used to evaluate the intensity of SA-β-gal-positive staining (g). Western blot was used to detect the protein expression of P53 and P16 (h). β-Actin was used as an internal control. ∗∗P < .05 vs. >65-year-old group, ∗P < .05 vs. < 25-year-old group. SA-β-gal: senescence-associated β-galactosidase; ROD: relative optical density.
