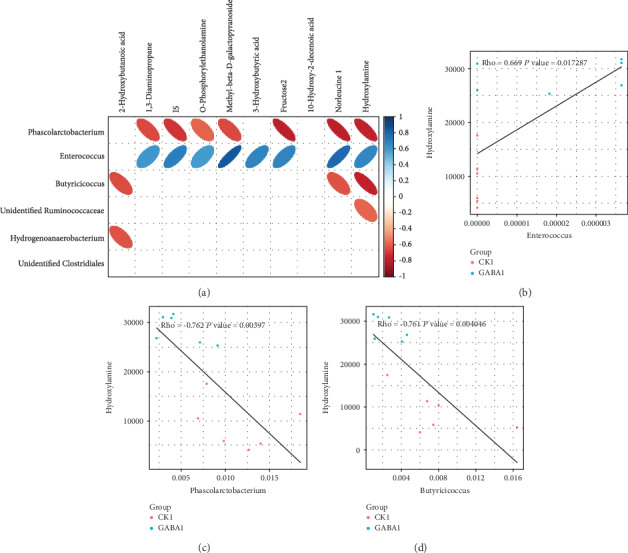
Figure 6.

The relationship between gut microbiota and metabolites in healthy piglets. (a) Correlation analysis heat map of differential bacteria and differential metabolites in normal piglets; (b) correlation analysis scatterplot of the content of hydroxylamine and the abundance of Enterococcus in normal piglets; (c) correlation analysis scatterplot of the content of hydroxylamine and the abundance of Phascolarctobacterium in normal piglets. The CK group in this figure means the CON group.
