Figure 4.

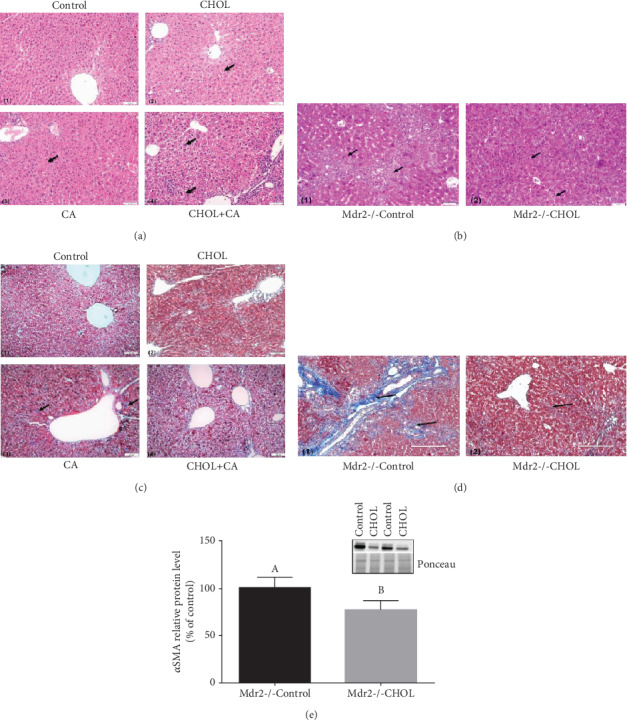
Liver histology and fibrosis. (a) Representative liver H&E staining of wild-type mice supplemented with atherogenic diet constituents. (1) Control liver sections. (2) Cholesterol- (CHOL-) treated group: presence of minor accumulation of lipid droplets. (3) CA-treated group: presence of necrotic cells with malformed nuclei. (4) CHOL+CA group: presence of ballooning degeneration of hepatocytes and accumulation of lipid droplets and Mallory-Denk bodies. Scale bar = 50 μm. (b) Representative liver sections of H&E staining of Mdr2-/- mice supplemented or not with cholesterol. (1) Mdr2-/- Control group: presence of necrotic areas and cells with malformed nuclei. (2) Mdr2-/- CHOL group: presence of ballooning degeneration of hepatocytes, increased nuclear-cytoplasmic ratio, and Mallory-Denk bodies (right). Scale bar = 50 μm. (c) Representative liver Masson's trichrome staining of wild-type mice. (1) Control group: no visible collagen lesions. (2) CHOL group: no visible collagen lesions. (3) CA group: presence of fibrotic collagen lesions colored blue. (4) CHOL+CA group: no visible collagen lesions. Scale bar = 50 μm. (d) Representative liver Masson's trichrome staining of Mdr2-/- mice supplemented or not with cholesterol. (1) Mdr2-/- Control group: heavy blue staining of fibrotic collagen lesions. (2) Mdr2-/- CHOL group lightly stained lesions. Scale bar = 200 μm. (e) Activation of fibrotic response: αSMA relative protein levels in liver tissue of Mdr2-/- mice, with and without cholesterol treatment. All values are expressed as mean ± SEM (n = 4). Means with different letters are statistically different, p < 0.05.
