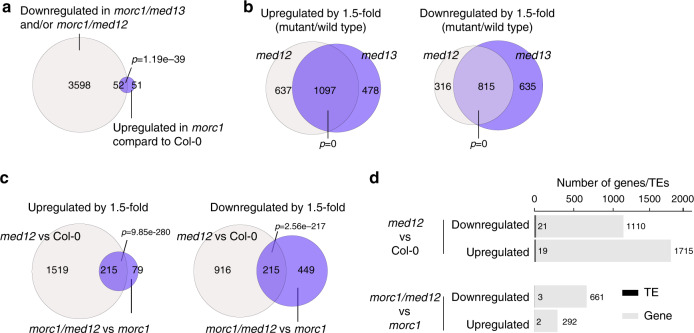
Fig. 2. Characterization of med12/13 differentially regulated genes.
a Venn diagram showing the overlap between genes that are downregulated in morc1/med12 and/or morc1/med13 mutants and those that are upregulated in morc1 background compared to wild-type (Col-0). Size is proportional to the number of genes defined for each group. p value indicates a statistical significance of the overlap (hypergeometric test, one sided). b Venn diagram showing the overlap between genes that are upregulated (left) and downregulated (right) in med12 and med13 compared to wild-type plants (fold change >1.5, FDR < 0.05). Size is proportional to the number of genes defined for each group. p value indicates a statistical significance of the overlap (hypergeometric test, one-sided). c Venn diagram showing the overlaps of med12 upregulated (left) and downregulated (right) genes between wild-type and morc1 background (fold change >1.5, FDR < 0.05). Data display conventions as in b. p value indicates a statistical significance of the overlap (hypergeometric test, one sided). d Bar chart showing the number of genes (gray) and TEs (black) that are differentially regulated by MED12 in wild-type (upper) and morc1 (lower) backgrounds. Source data are provided as a Source data file.

