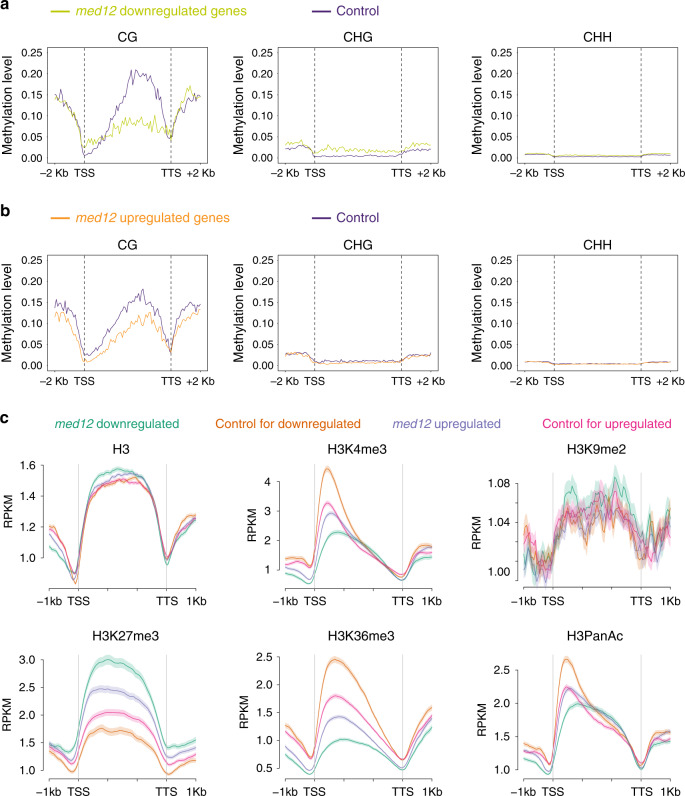
Fig. 3. Characterization of epigenetic features of med12 differentially regulated genes.
a Average distribution of DNA methylations over med12 downregulated genes in three different sequence contexts (left to right, CG, CHG, and CHH). Control represents a group of randomly selected MED12 non-DEGs of similar expression levels. −2 kb and +2 kb represent 2 kb upstream of transcription start site (TSS) and 2 kb downstream of transcription termination site (TTS), respectively. b Same as in a, except for med12 upregulated genes. c Average distribution of histone modifications over med12 DEGs, distinguishing genes downregulated (green) and upregulated (purple) in med12 from corresponding controls of similar expression levels (orange and pink, respectively). Top row from left to right, H3, H3K4me3, H3K9me2; Bottom row from left to right, H3K27me3, H3K36me3, H3PanAc. Shaded area represents the standard error (SEM) centered on mean value (dark solid lines). n = 3 biologically independent samples.

