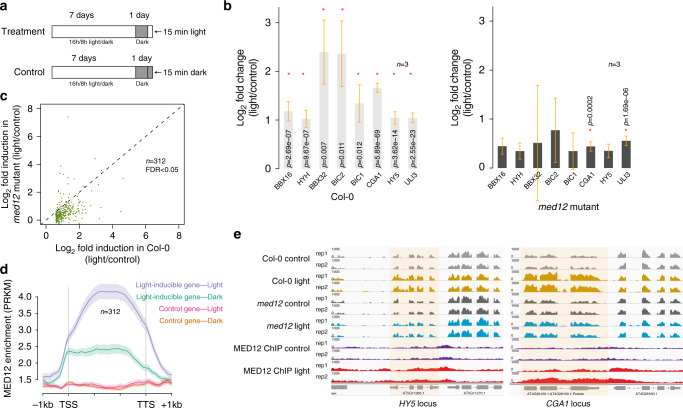
Fig. 7. Role of MED12 in mediating light-induced transient gene expression.
a Schematic illustration of the light and control treatments. b Bar plot of light-responsive gene fold induction under light treatments. Left, wild-type plants (Col-0); Right, med12 mutant plants. Asterisks indicate statistical significance in gene expressional changes (Benjamini–Hochberg adjusted p value, two sided). Data are presented as mean values +/− SE. n = 3 biologically independent samples. c Scatter plot showing the fold induction of light-inducible genes in Col-0 and med12 mutant plants upon light treatments. Each dot represents one light-inducible gene with its x-axis position showing fold induction in Col-0 and y-axis position showing fold induction in med12 mutant. The dotted line represents the 45° reference line. d The average distribution of MED12 over light-inducible genes and control genes in the light-treated (purple and red) and non-treated (green and orange) plants. Shaded area represents the standard error (SEM) centered on mean value (dark solid lines). n = 3 biologically independent samples. e Screen shots showing gene expression and MED12 enrichments at HY5 (left) and CGA1 (right) locus under the light-treated and non-treated conditions. Top four tracks, gene expression in Col-0; middle four tracks, gene expression in med12 mutants; bottom four tracks, MED12 enrichments in MED12 complementing plants. Source data underlying b, c are provided as a Source data file.

