Figure 5.
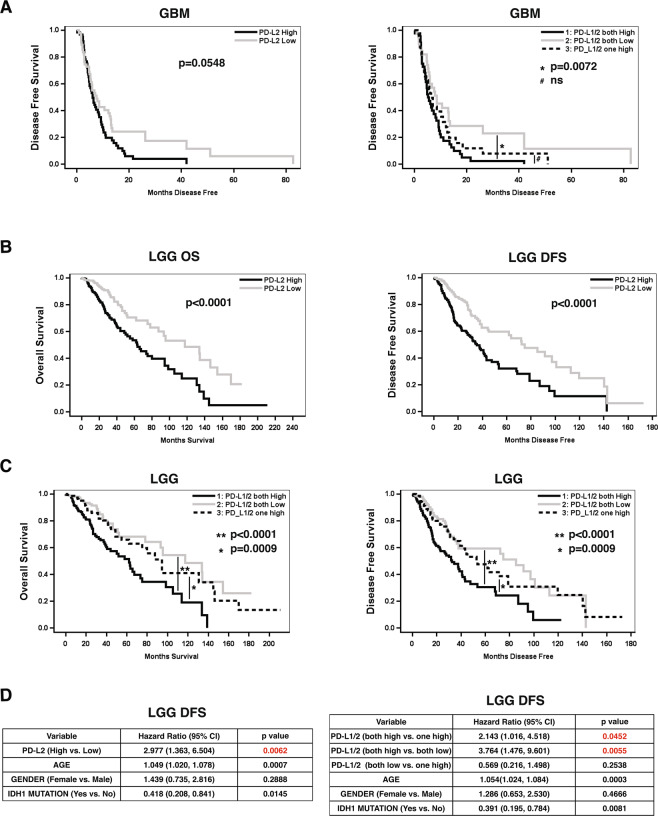
PD-L1 and PD-L2 Expression Levels and Clinical Outcomes in Glioma. (A) Kaplan-Meier disease free survival estimates for GBM patients with high expression of PD-L2 (left) and either high expression of both PD-L1/L2, high expression of either PD-L1/L2, or low expression of both (right)(*p = 0.0072; #, ns = not significant). (B) Kaplan-Meier estimates of OS (left panels) and DFS (right panels) based on high (dark) or low (grey) PD-L2 expression. (C) Kaplan-Meier estimates of OS (left) and DFS (right) in LGG patients with either high expression of both PD-L1/L2, high expression of either PD-L1/L2, or low expression of both (** =p < 0.0001, * = p = 0.009).(D) Multivariate analysis for DFS shows PD-L2 is an independent factor in LGG patients after adjusting by covariates of age, gender and IDH1 mutation (p = 0.0062) (left); Multivariate analysis shows PD-L1/2 both high is independently associated with shorter DFS in LGG patients compared to “both low” (p = 0.0055) or “one high” (p = 0.0452) after adjusting by covariates age, gender and IDH1 mutation (right).

