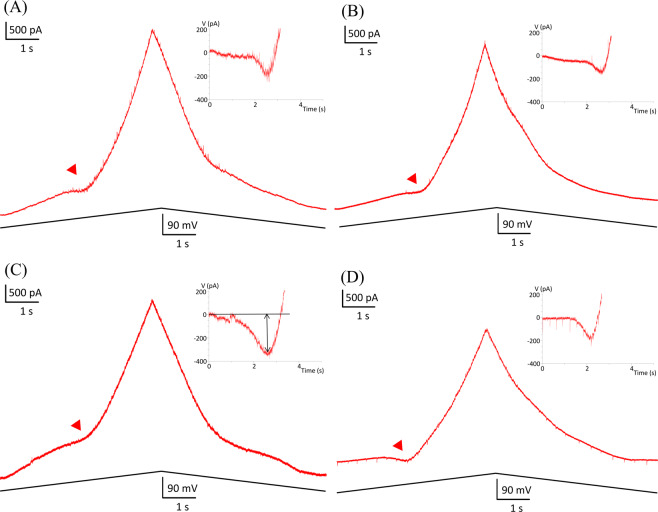
Figure 4.
Comparison of persistent inward currents (PICs) in wild-type and hG93A-SOD1 motoneurons. A and C, PICs induced by slow, voltage bi-ramps (20 mV/s, from −80 mV to +10 mV) are indicated by the red arrows. The hG93A-SOD1 motoneurons (C) showed significantly larger PICs than the wild-types (A). The current response was then subtracted by leak current calculated before PIC happened as shown by linear fitting line, the black solid line in inlet of (C). B and D, for wild-type (B) and hG93A-SOD1 (D) received PF-4708671, they showed similar PIC amplitude as in (A). The average amplitudes of PIC of wild-type and hG93A-SOD1 were reported in Table 2.

