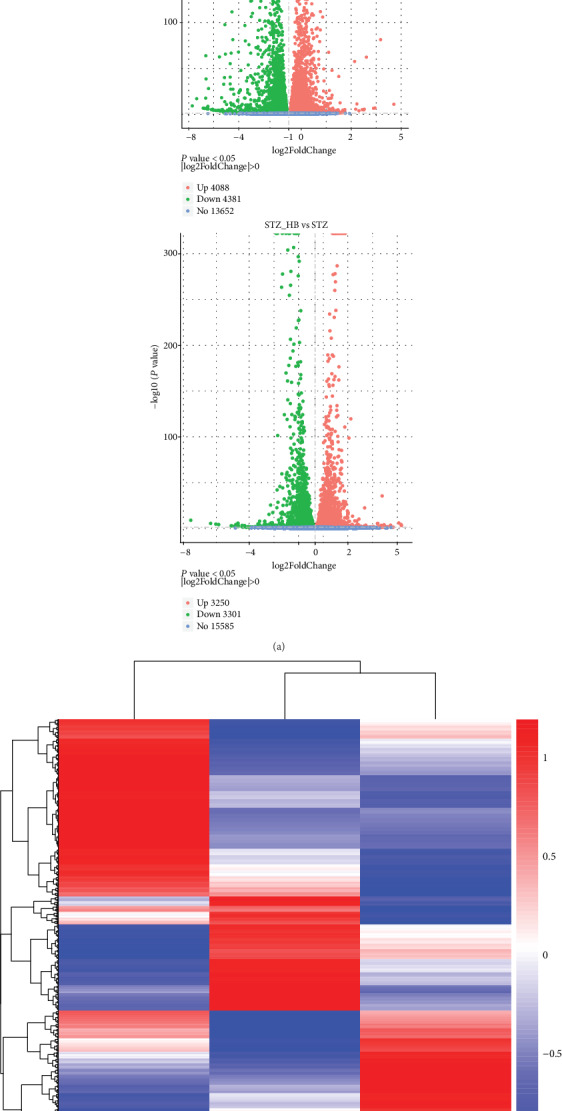
Figure 2.

Gene expression profiling of HB-mediated wound healing in STZ-induced diabetes. (a) Differentially expressed genes (DEs) in the STZ group compared with the Con group (nondiabetic rats) and HB-treated group compared with the STZ group; upregulated DEs were shown as red dots, and downregulated DEs shown green with no significant genes as blue dots; (b) hierarchical clustering of differentially expressed genes presented as a heat map of different groups.
