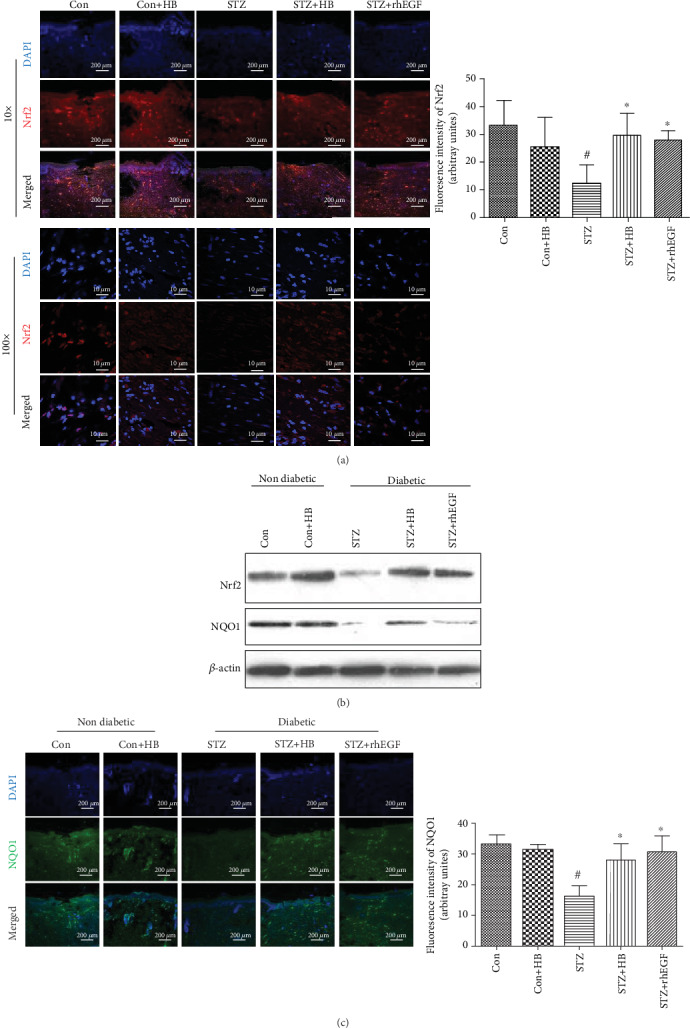
Figure 5.

HB treatment-activated Nrf2 and its downstream NQO1 in STZ-induced wound model. (a) immunofluorescence staining of Nrf2 (red) and its quantitative results (n = 3 − 5 animals per group); nucleus (blue); (b) the representative western blotting results of Nrf2 and NQO1; (c) immunofluorescence staining of cleaved caspase 3 (green) and its quantitative results (n = 3 − 5 animals per group); scale bar: 200 μm, nucleus (blue); the data were expressed as mean ± SD, and significance was expressed as #P < 0.05 vs Con and ∗P < 0.05 vs STZ.
