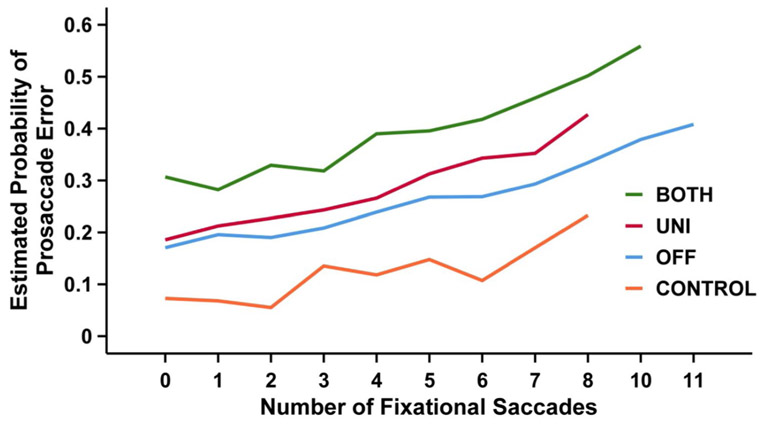
Fig. 3.
Association between number of fixational saccades and the probability of a prosaccade error. This plot shows the mean estimated probability of committing a prosaccade error (y-axis) for a given number of fixational saccades (x-axis) for the OFF (blue line), UNI (red line), and BOTH (green line) stimulation conditions in patients with PD and age- and sex-matched healthy controls (orange line)

