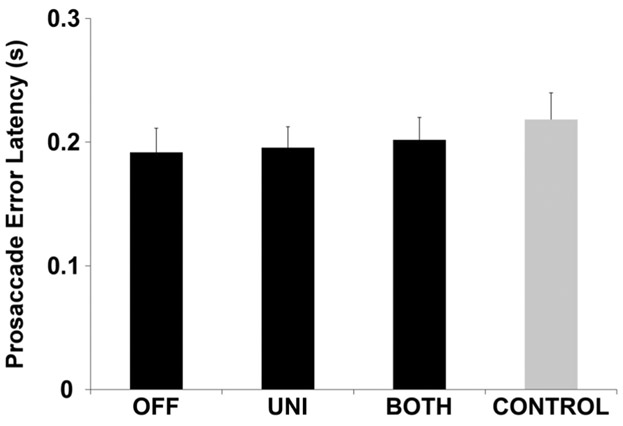
Fig. 5.
Prosaccade error latency. This plot shows the estimated mean prosaccade error latency and standard error for participants with PD during OFF, UNI, and BOTH stimulation conditions (black bars) and healthy, age- and sex-matched controls (gray bar). There were no significant differences between conditions

