Fig. 5.
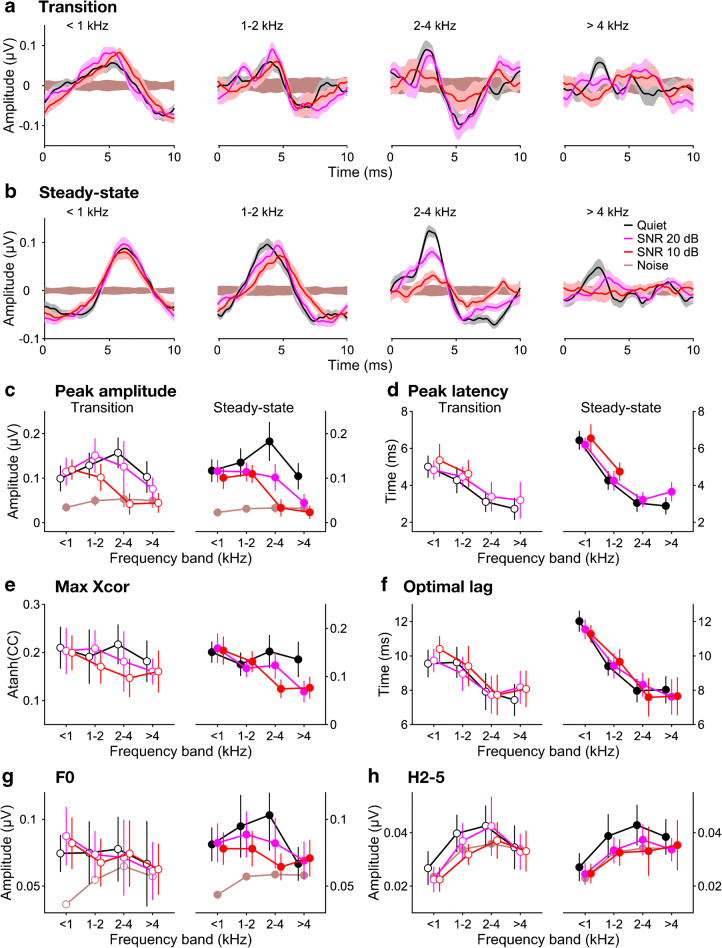
Background noise effects on derived-band speech ABRs. a, b Grand-average waveforms (N = 12) of averaged response peaks, overlaid for different noise conditions and plotted as for the broadband responses in Fig. 3a. Panels a and b show the transition and steady-state portions, respectively, and the different axes with each panel show the different frequency bands (ordered from low to high; see axis titles). c, d Average derived-band amplitudes (c) and latencies (d) across participants as a function of derived frequency band. The parameter is the noise condition (same colours as in a and b). The results for the transition and steady-state portions are shown on the left and right, respectively. The error bars show the 95% CIs across participants. The brown symbols and lines in panel c show the amplitudes of the noise floor for each frequency band. e, f Average stimulus-to-response correlations across participants (e) and optimal correlation lags (f). g, h Average F0 (g) and harmonic (H2–5) amplitudes (h) across participants. The brown symbols and lines show the corresponding noise floor amplitudes

