
Fig. 2.
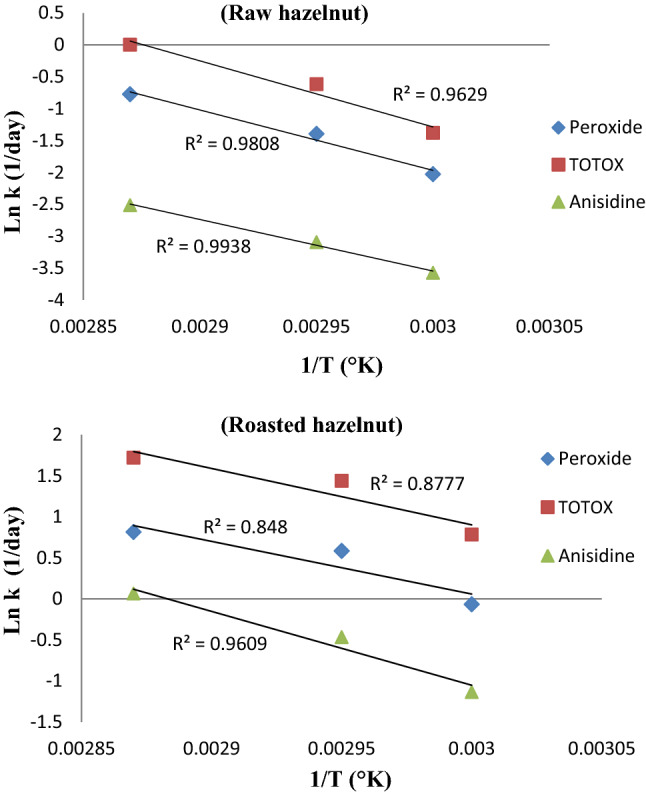
Arrhenius graph from plotting the natural logarithm of rate constant of the indices (Ln kPV, Ln kAnV, and Ln kTOTOX) for raw and roasted hazelnuts stored at 55, 65 and 75 °C against reverse absolute temperature (1/°K)
Official websites use .gov
A
.gov website belongs to an official
government organization in the United States.
Secure .gov websites use HTTPS
A lock (
) or https:// means you've safely
connected to the .gov website. Share sensitive
information only on official, secure websites.
Arrhenius graph from plotting the natural logarithm of rate constant of the indices (Ln kPV, Ln kAnV, and Ln kTOTOX) for raw and roasted hazelnuts stored at 55, 65 and 75 °C against reverse absolute temperature (1/°K)