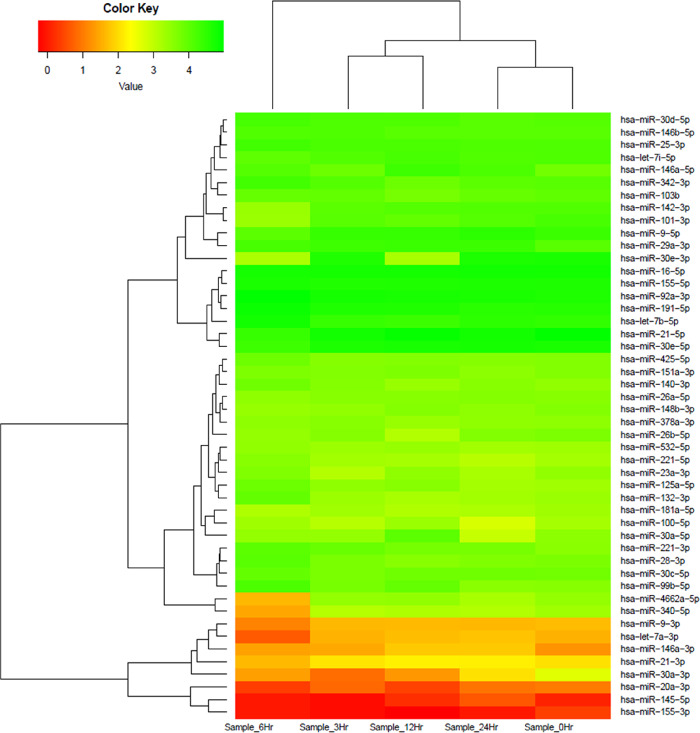
Figure 3.
Heatmap and hierarchical clustering of infection-specific miRNAs. Heatmap and hierarchical clustering of 48 infection-specific differentially expressed key miRNAs in THP-1 cells in response to Leishmania infection at 3, 6, 12, and 24 h as compared to the infected 0 h control. The heatmap shows several members of key families of miRNAs (miR-146, let-7, miR-30, miR-155, miR-21, and miR-9) differentially modulated across different time points. The miRNA expression values are presented using a green (upregulated), yellow (median value), and red (downregulated) color scheme.

