Abstract
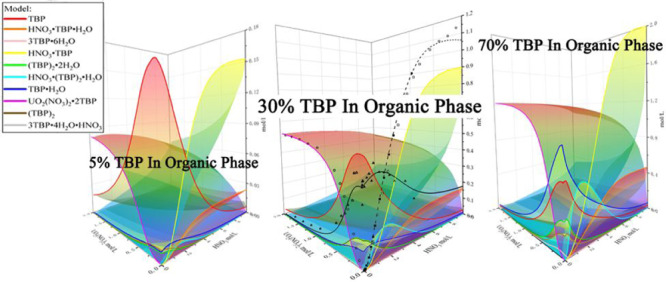
Uranium is a strategic element and plays an important role in energy resources. A H2O–HNO3–UO2(NO3)2–TBP (tri-n-butyl phosphate)–diluent system is commonly used for uranium separation and purification in liquid–liquid extraction. Uranyl nitrate is promoted by the existence of nitrate at low HNO3 concentrations but is inhibited at high HNO3 concentrations. Considering the competitive extraction between HNO3 and UO2(NO3)2, a generic extraction model is developed. The activities of components in the aqueous phase were estimated using Pitzer models. The thermodynamic equilibrium constants and Pitzer parameters were regressed by experimental data. The resulting model was able to successfully predict uranyl nitrate, nitric acid, and water extraction over a large range of conditions (U, 0–1.8 mol/L; HNO3, 0–10 mol/L; TBP, 5–100 vol %) within average absolute relative deviations of 11.2, 15.7, and 23.8%, respectively. The predicted results show that water and nitric acid were extracted as di-solvates HNO3·(TBP)2·H2O and (TBP)2·2H2O at low nitric acid concentrations, with the formation of mono-solvates HNO3·TBP and HNO3·TBP·H2O as the acid concentration increased. Uranyl nitrate was shown to be rejected from the organic phase as the formation of HNO3·TBP and HNO3·TBP·H2O in acid was extracted at high acid concentrations.
1. Introduction
Nuclear power has been in use for one purpose or another for over three decades. For most of that time, it has been considered essential to reprocess the fuel to recover valuable materials, initially for military purposes and more recently to make the best use of finite energy resources and facilitate fission product waste management. So far, the most successful recovery of uranium and plutonium from irradiated fuel technology has been through the Purex process, which uses solvent extraction among aqueous uranyl nitrate, nitric acid solutions, and organic solutions of tri-n-butyl phosphate (TBP) diluted with hydrocarbons, such as kerosene, dodecane, and paraffins.
The mathematical description of partition equilibrium for uranium is necessary for flowsheet designs, process controls, and optimization.1,2 There is a wealth of experimental data and analytical models working on uranyl nitrate and nitric acid extraction by TBP.3−5 Considering the potential effects on complexation due to TBP hydration in the organic liquid phase, Hlushak et al. developed a model for the extraction of all species (uranyl nitrate, nitric acid, and water) with 30 vol % TBP.2 Jové Colón et al. used the Gibbs energy minimization (GEM) method to predict the extraction isotherm for H2O–HNO3–UO2(NO3)2–TBP–diluent in low concentrations of acid (HNO3, 0.01 mol/L).6 Puzikov et al. simulated the extraction isotherm in the presence of salting-out agents.7 However, it should be noticed that most existing modeling works on uranyl nitrate and nitric acid extraction equilibria are based on the experimental data with a limited concentration range, which correspond to the limited range of prediction.
For example, a previous study has shown that the existence of nitrate promotes the extraction of uranyl nitrate by TBP at low HNO3 concentrations, while the extraction of uranyl nitrate is inhibited at high HNO3 concentrations (HNO3 > 4 mol/L).8 An effective mathematic model for uranyl nitrate and nitric acid extraction for these conditions (HNO3, 0–10 mol/L) is still lacking.
This limit arises from the variety of extracted species, the solvation numbers reported, and also the conditions at which these species are determined.9 To extend the predicted range of thermodynamic model, the competitive extraction between uranyl nitrate and nitric acid was taken into account.
In general, solving the isoactivity (the K-value method) equations is numerically easier than GEM, such as calculating the liquid–liquid equilibrium based on solving the isoactivity equations with a nonrandom two-liquid (NRTL) model.10 In the present work, the extraction equilibria for uranyl nitrate extraction with diluted TBP and different HNO3 concentrations in the aqueous phase were experimentally studied. Based on our experimental results and previous research results of others, such as the coextraction of nitric acid and water together with a dimer,5 the necessity of HNO3·3TBP complexes in modeling distribution data of nitric acid and water,11 the assumption that the extraction reactions of nitric acid with TBP also occur in the simultaneous extraction of acid and uranium,12 a generic model was developed by combining a series of equilibrium equations of two systems (HNO3–H2O–TBP–diluent and UO2(NO3)2–H2O–TBP–diluent systems) into a comprehensive framework.
This treatment contributes to understanding the competitive extraction between uranium and nitric acid, understanding the influence of acid concentration on the coextraction of water in the UO2(NO3)2–HNO3–H2O–TBP–diluent system, and predicting the concentrations of all complexes in the organic phase under a large range of experimental conditions (0–1.8 mol/L uranyl nitrate, 0.01–10 mol/L nitric acid, 5–100 vol % TBP).
2. Experimental Section
Analytical reagent (AR)-grade nitric acid and deionized water were used to make an aqueous solution. Uranyl nitrate samples were made from the uranyl nitrate stock solution (400 g/L uranium).
Solvents were prepared using commercial-grade samples without further purification. All solvent concentrations were quoted as volume/volume percentages. The diluent in all tests was Shellsol 2046, a kerosene-based diluent containing approximately 17% aromatics, supplied by Shell.
All isotherms were completed with the same solution concentrations at different O/A ratios (the volume ratios between organic and aqueous phases). The samples were then shaken for 3 min by hand followed by keeping for 1 h in a temperature-controlled shaker at 298.15 ± 1 K. This was repeated twice. The aqueous and organic phases were separated. Only the aqueous-phase samples were diluted and analyzed via inductively coupled plasma (ICP) for their metal content. The concentration of metals in the organic phase was calculated by a mass balance using the initial concentration. Volume change for the organic phase after equilibration was negligible for the whole range of TBP concentration. All experiments were carried out in triplicate, and the mean value was used in all cases. The standard deviation of extraction equilibrium measurements was always found to be within 5%.
The diluent phase is considered to be a part of the organic liquid mixture for the calculation of solvent molarities, but it is assumed to be nonreactive or inert. That is, the diluent as a system component does not take part in any of the equilibria between liquids, but its presence in the organic phase is still accounted for in the volumetric calculations.2,6 Since a large amount of experimental data for water and nitric acid extraction by TBP was already available, no further experimental data was necessary. The data sources of activity coefficient and extraction equilibrium for different systems are given in Tables 1 and 2. According to the literature, all experiments were carried out at 298.15 ± 1 K. Experimental works on HNO3 and UO2(NO3)2 extraction have been studied extensively due to its importance in the nuclear industry. The consistency of experimental data obtained from different literature works is satisfactory.
Table 1. Data Sources of Activity Coefficients for HNO3 and UO2(NO3)2.
| concentration range [mol/L] |
|||
|---|---|---|---|
| system | refs | HNO3 | UO2(NO3)2 |
| HNO3–H2O | Davis13 | 0–23 | |
| Zongcheng et al.14 | 0–5.6 | ||
| UO2(NO3)2–H2O | Davis et al.3 | 0–2.5 | |
| Goldberg15 | 0–5.51a | ||
| UO2(NO3)2–HNO3–H2O | Ochkin et al.16 | 0–5.5 | 0–0.5672a |
Concentration unit is mol/kg.
Table 2. Data Sources of Extraction Equilibrium for HNO3–H2O–TBP, UO2(NO3)2–H2O–TBP, and UO2(NO3)2–HNO3–H2O–TBP in Diluent Systems.
| concentration range [mol/L] |
|||||
|---|---|---|---|---|---|
| system | refs | HNO3 | UO2(NO3)2 | TBP (vol %) | diluent |
| HNO3–H2O–TBP–diluent | Burns and Hanson17 | 0.35–10 | 20–30 | kerosene | |
| Marin et al.18 | 1–4 | 15–20 | dodecane | ||
| Davis19 | 0.01–8.5 | 10–100 | Amsco 125–82 | ||
| Davis et al.20 | 0.1–10 | 100 | |||
| Balasubramonian et al.21 | 0.01–7 | 30 | dodecane | ||
| Zongcheng et al.14 | 0–5.6 | 5–100 | n-heptane | ||
| UO2(NO3)2–HNO3–H2O–TBP–diluent | Puzikov et al.22 | 0.05–5 | 0.01–0.257 | 30 | paraffins |
| Hlushak et al.2 | 1.79–5.99 | 0–1 | 30 | dodecane | |
| Stas et al.8 | 0.5–7a | 0–0.5a | 20 | kerosene | |
| this work | 0.01–4.14 | 0.05–1.8 | 10–40 | kerosene | |
| UO2(NO3)2–H2O–TBP–diluent | Davis et al.3 | 0–2.5 | 30 | Amsco 125-82 | |
Values are extracted from the graph.
3. Mathematical Modeling
The modeling of extraction of various components by a solvent in the organic phase is usually divided into two parts, the calculation of organic and aqueous phase nonideality and the modeling of solvent extraction from experimental data.
3.1. Aqueous Phase Nonideality
3.1.1. Pitzer Model
The Pitzer model extended the Debye–Hückel method using a virial expansion to account for the ionic strength dependence of the short-range forces in binary and ternary ion interactions. Ignoring the unsymmetrical mixing terms, the calculation of stoichiometric mean activity coefficients of single-electrolyte solutions can be written as follows
 |
1 |
where the subscripts c and a refer to the cation and anion, respectively, ∑c and ∑a denote the sum over all cations and anions in the mixture, z is the charge of the subscripted species, m is the concentration of the subscripted species in molality, vM and vX are the stoichiometric numbers of ions M and X in the salt, respectively, v = vM + vX, I = 1/2∑imizi2 is the ionic strength of the mixture, and ∑mz = ∑cmczc = ∑ama|zc| is the total equivalent molality.
The term f′(I) in eq 1 is defined by
| 2 |
where Aϕ and b are the Debye–Hückel constant, Aϕ = 0.392, and b = 1.2 at 25 °C.
The quantity
| 3 |
is a function of ionic strength (also temperature and solvent properties) expressing the effect of long-range electrostatic forces.
The terms Bca, Bca′, and Cca are responsible for the two-ion interaction contribution to excess Gibbs energy and are given by the following equations
| 4 |
| 5 |
| 6 |
with α = 2. β(0), β(1), and Cϕ are single-salt Pitzer parameters describing the interactions between two ions with the opposite signs (−/+ interactions).
The activity of water in the electrolyte solution can be calculated by
| 7 |
where Mw is the molecular weight of H2O and ϕ is the osmotic coefficient of the solution, which can be calculated using Pitzer’s equation
| 8 |
Densities of mixed solutions daq are necessary to calculate molality, and the solution density daq (g/cm3) was determined using the equation23
| 9 |
3.1.2. Pitzer Parameter Evaluation
To choose the most accurate Pitzer parameters, activity coefficients calculated using different Pitzer parameters from each source were compared to the experimental values in Table 1. The calculated activity coefficients of uranyl nitrate and nitric acid were determined using eq 1–6 with the correlation parameters β(0), β(1), and Cϕ from the works of Li et al.,24 Hlushak et al.,2 and Jové Colón et al.6 and our results (Table 3).
Table 3. Comparison of Various Reported Single-Salt Pitzer Parameters.
| reference | salt | β(0) | β(1) | Cϕ | expt. sources |
|---|---|---|---|---|---|
| Li et al.24 | HNO3 | 0.1119 | 0.3206 | 0.0010 | a |
| UO2(NO3)2 | 0.4607 | 1.613 | 0.03154 | a | |
| Hlushak et al.2 | HNO3 | 0.1083 | 0.4165 | –0.002014i | b |
| UO2(NO3)2 | 0.5104 | 1.0677 | –0.01655i | b | |
| Jové Colón et al.6 | HNO3 | 0.123757 | 0.31055 | –0.005539 | c |
| UO2(NO3)2 | 0.47803 | 1.5953 | –0.03971 | d | |
| our results | HNO3 | 0.1283 | 0.311 | –0.003980 | a,e,f,g,h |
| UO2(NO3)2 | 0.4558 | 1.572 | –0.02779 | e,h,i |
The effects of HNO3 and UO2(NO3)2 concentrations on water activities were calculated using different Pitzer parameters, and the results are shown in Figure 1. In general, the model presented by Li et al.24 tends to underestimate in the high concentration ranges of UO2(NO3)2 and HNO3, the models presented by Hlushak et al.2 and Jové Colón et al.6 and our results reflected well the experimental data.
Figure 1.
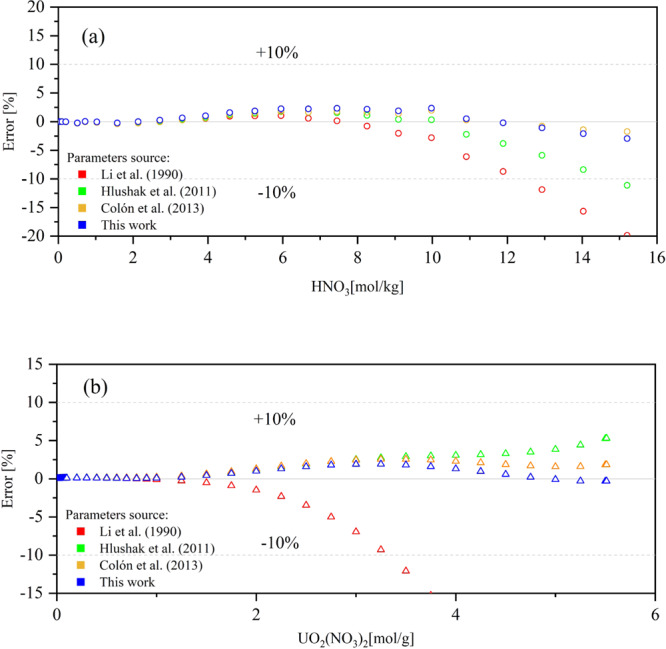
Percentage difference between calculated and literature values of water activities for Pitzer paraments of Li et al.,24 Hlushak et al.,2 Jové Colón et al.,6 and our results: (a) experiment data of Davis13 and (b) experiment data of Goldberg.15 Reprinted from ref (13), Copyright (1962), with permission from Elsevier. Reprinted from ref (15), with the permission of AIP Publishing.
It can be seen from Figure 2 that the predication of the uranyl nitrate activity coefficient using Li’s Pitzer parameter24 has a large deviation in the high concentration range (Figure 2d, red). The parameters obtained by Hlushak et al.2 model the nitric acid activity coefficients well, but a sharp deviation of the uranyl nitrate activity coefficients is observed in Figure 2d (green). The reason for this can be the fact that Hlushak et al.2 fitted the parameters in the concentration of uranyl nitrate lower than 3.5 mol/kg. Jové Colón et al.6 regressed the Pitzer paraments from the Kim and Frederick26 experimental data. The uranyl nitrate activity coefficients could be predicted well by Colón’s Pitzer parameters, but the prediction of nitric acid activity coefficients has a large deviation. Using the Pitzer parameters regressed in our work, there is no significant deviation observed in the prediction of all experimental data. Hence, the Pitzer paraments modified by our works were adopted in the description of aqueous-phase nonideality.
Figure 2.
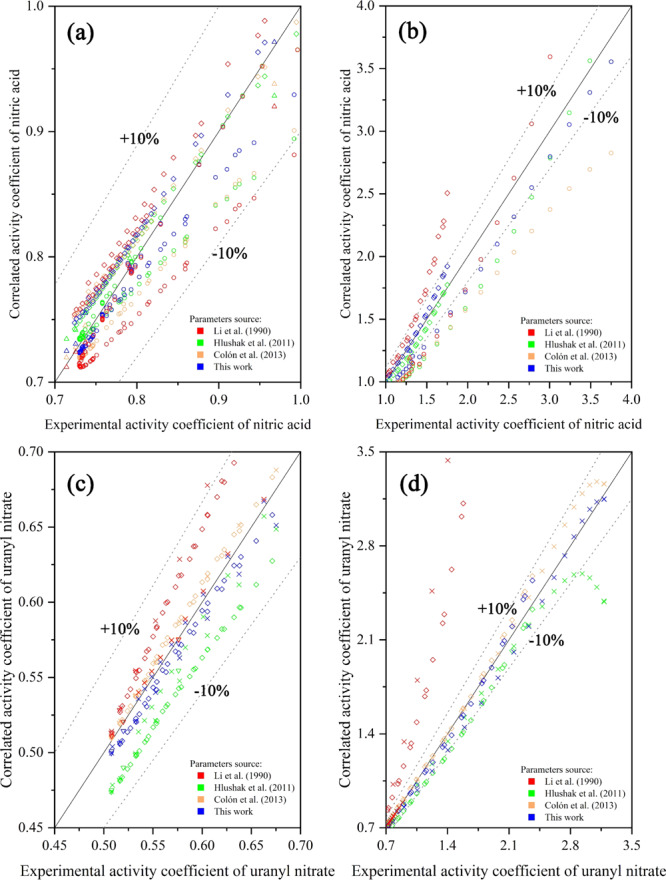
Predicted activity coefficients nitric acid (a, b) and uranyl nitrate (c, d) using the Pitzer paraments of Li et al.,24 Hlushak et al.,2 Jové Colón et al.,6 and our results versus experimental results: (a) 0.7–1 nitric acid activity coefficients; (b) 1–4 nitric acid activity coefficients; (c) 0.45–0.70 uranyl nitrate activity coefficients; (d) 0.7–3.5 uranyl nitrate activity coefficients; (◇) = experiment data of Ochkin et al.;16 (○) = experiment data of Davis13 and Davis et al.;13 (△) = experiment data of Zongcheng et al.;14 (×) = experiment data of Goldberg.15 Reprinted from ref (3), Copyright (1970), with permission from Elsevier. Reprinted from ref (13), Copyright (1962), with permission from Elsevier. Reprinted from ref (14), Copyright (1989), with permission from Elsevier. Reprinted from ref (15), with the permission of AIP Publishing. Reprinted from ref (16), Copyright (2016), with permission from Elsevier.
3.2. Reaction Modeling
3.2.1. Extracted Species
Since the early 1960s, the modeling of extraction of nitric acid has been studied extensively.19 Suggested complexes such as three species,21,27 five species,5,28 six species,29 and nine species11 were proposed by different works. Most of these organic complexes were presumed to associate with the TBP monomer. A few investigators suggested that TBP monomers in the dimer were bound in parallel, and the dimer may also play a role in extraction. According to the assumption of previous work,11 in the absence of metals, nine complexes can form in the organic phase: HNO3·TBP, HNO3·TBP·H2O, HNO3·2TBP·H2O, HNO3·3TBP·4H2O, HNO3·H2O, H+NO3–·10H2O, 3TBP·6H2O, TBP·H2O, and 2TBP·2H2O. For this work, considering the model developed by Čomor et al.4 with the presence of a metal, a schematic similar to, but not identical to, Naganawa and Tachimori was used.11 Ignoring the extraction of nitric acid (H+NO3·10H2O) free from TBP, the chemical reactions can be written as
where the superscript “—” denotes the species in the organic phase, while the lack of a subscript denotes the species in the aqueous phase. In this study, the TBP self-association equilibrium was considered since some investigators suggested that the TBP dimer itself also plays a role in extraction,5,8,12,30 which is different from Naganawa and Tachimori.11
3.2.2. Basic Relations
Based on the discussion in Section 3.2.1, the partition equilibrium and the corresponding equilibrium constants can be generally expressed as
 |
10 |
where H, D, T, W, and U denote nitric acid, TBP dimer, TBP monomer, water, and uranyl nitrate, respectively, and h, l, m, n, and t are the stoichiometric numbers of nitric acid, dimerization of TBP, TBP, water, and uranyl nitrate, respectively.
The thermodynamic equilibrium constant for the formation of the hH·lD·mT·nW·tU complex based on the partition equilibrium eq 10 can be presented as
| 11 |
where aX is the stoichiometric mean activity of component X in the aqueous phase.
Considering no ionic species and weaker solvation interactions, such as hydrogen bonding and dipole–dipole interactions, than complex interaction in the nonpolar solvent,11,31 no activity coefficients of complexes in the organic phase are computed and the value is equal to one. [X] is the molar concentration of component X in the organic phase.
where γA and γU represent the stoichiometric activity coefficients of nitric acid and uranyl nitrate and CHaq and CU are their molarities of H+ and UO22+. The stoichiometric activity coefficients were calculated as explained in Section 3.1.
From eq 11, we therefore obtain the basic relation
| 12 |
in which the dimerization of TBP can be given as
| 13 |
The basic relation eq 12, together with eq 13, yields to
| 14 |
Hence, Ch,l,m,n,t can be expressed as a function of [T], CUaq, and CH. The total concentrations of uranyl nitrate, TBP, nitric acid, and water in the organic phase can be written as follows
| 15 |
| 16 |
| 17 |
| 18 |
To extend the model to wider experimental conditions, a new term R, the volume ratios between organic and aqueous phases, was added into the model
| 19 |
where CH,0aq and CH,0 are the initial concentrations of nitric acid in the aqueous phase and organic phase and CHaq and CH are the total concentrations of nitric acid in the aqueous phase and organic phase at equilibrium.
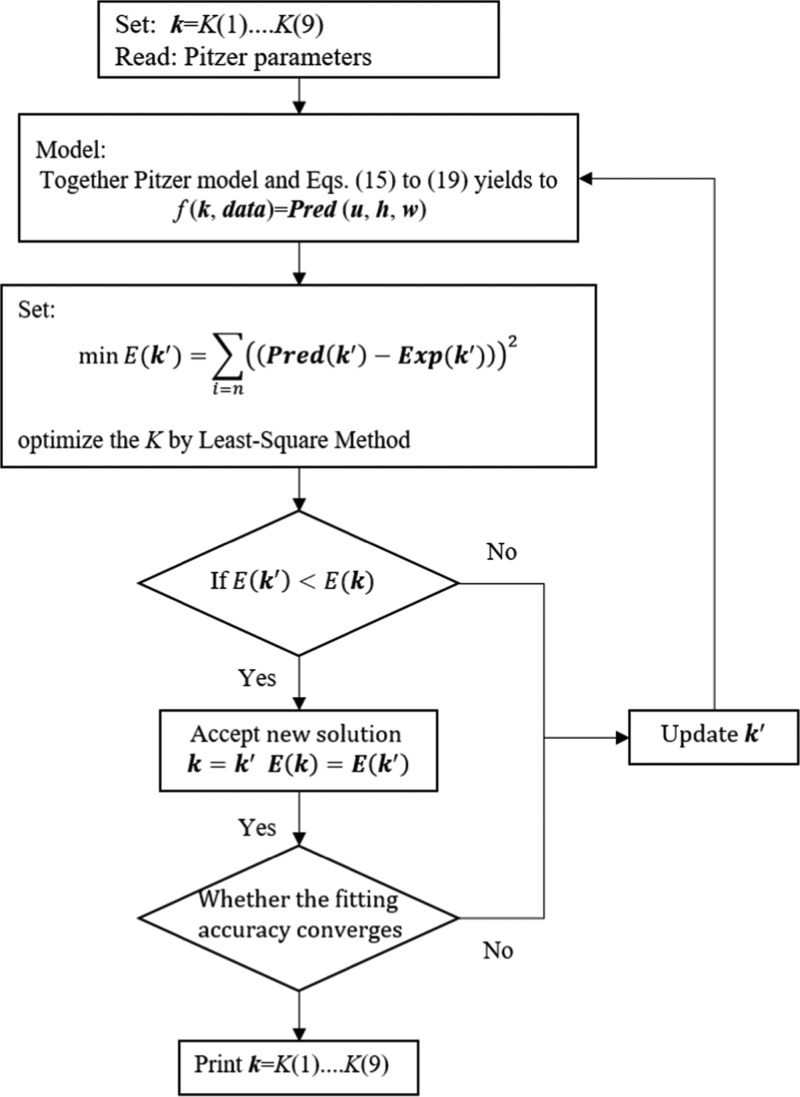
Once the values of CTorg, CU, CH,0aq, CH,0, and R are known, for every given values of equilibrium constants, Kh,l,m,n,t, eqs 14–19 can be solved numerically and the concentrations of CH,predorg (nitric acid),CU,pred (uranyl nitrate), and CW,predorg (water) in the organic phase are calculated by eqs 15–17. By minimizing the following objective function (eq 20) using the MATLAB optimization routine, Kh,l,m,n,t can be regressed to optimally reproduce the distribution data in Table 1.
| 20 |
For the consideration of mathematic calculation, the concentration of uranyl nitrate in the aqueous phase was set as 2 × 10–11 mol/L in the nitric acid–water–TBP–diluent system, and the concentration of nitric acid in the aqueous phase was set as 0.0001 mol/L in the uranyl nitrate–water–TBP–diluent system.
In summary, the mathematic program for the calculation of Kh,l,m,n,t with the experimental data is shown in the flowchart (Figure 3). K(1)–K(9) correspond to K0,1,0,0,0, K1,0,1,0,0, K0,0,2,0,1, K1,1,0,1,0, K1,0,1,1,0, K1,0,3,4,0, K0,0,1,1,0, K0,1,0,2,0, and K0,0,3,6,0.
Figure 3.
Flowchart of the equilibrium constants determination by the least-squares algorithm.
4. Results and Discussion
The structures of the complexes used in this work are (TBP)2, HNO3·TBP, HNO3·(TBP)2·H2O, HNO3·TBP·H2O, TBP·H2O, (TBP)2·2H2O, 3TBP·6H2O, HNO3·3TBP·4H2O, and UO2(NO3)2·2TBP. The regressed equilibrium parameters are presented in Table 4.
Table 4. Summary of Regressed Equilibrium Contests in the Generic Model.
| species | equilibrium contests |
|---|---|
| (TBP)2 | K0,1,0,0,0 = 0.5334 |
| HNO3·TBP | K1,0,1,0,0 = 0.1954 |
| HNO3·(TBP)2·H2O | K1,1,0,1,0 = 4.9544 |
| HNO3·TBP·H2O | K1,0,1,1,0 = 0.09 |
| HNO3·3TBP·4H2O | K1,0,3,4,0 = 0.0525 |
| TBP·H2O | K0,0,1,1,0 = 0.0012 |
| (TBP)2·2H2O | K0,1,0,2,0 = 0.00018 |
| 3TBP·6H2O | K0,0,3,6,0 = 0.02255 |
| UO2(NO3)2·2TBP | K0,0,2,0,1 = 14.254 |
4.1. HNO3–H2O–TBP–Diluent System
The extraction of H2O and TBP species in the organic phase was calculated in our model and is shown in Figure 4. The model can predict the experimental data well under different volume percentages of TBP except the undiluted condition (100% TBP) in which there is a significant deviation as HNO3(aq) concentration is below 4 mol/L. The extraction of HNO3 and species in the organic phase was calculated and is shown in Figure 5. It can be seen that the predicted results are in good agreement with the experimental data.
Figure 4.
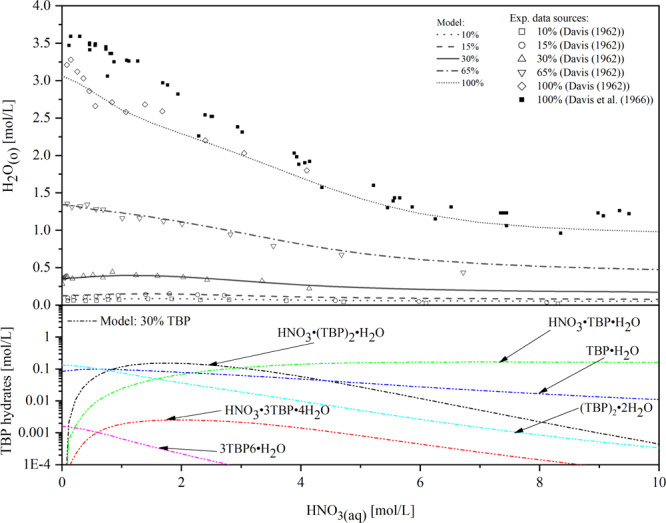
Comparison of the modeling of H2O extraction for different TBP concentrations (10–100 vol % TBP) with literature data19,20 and modeled speciation of TBP hydrates in the organic phase with 30 vol % TBP. Reprinted with permission from ref (19). Copyright [1962] [Taylor & Francis]. Reprinted from ref (20), Copyright (1966), with permission form Elsevier.
Figure 5.
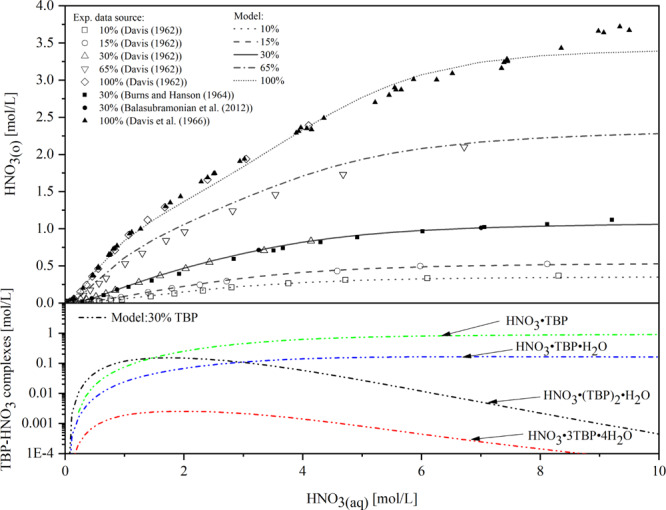
Comparison of the modeling of HNO3 extraction for different TBP concentrations (10–100 vol % TBP) with literature data17,19−21 and modeled speciation of nitric acid in the organic phase for 30 vol % TBP. Reprinted with permission from ref (17). Copyright [1964] [John Wiley & Sons]. Reprinted with permission from ref (19). Copyright [1962] [Taylor & Francis]. Reprinted from ref (20), Copyright (1966), with permission form Elsevier. Reprinted by permission from [Springer Nature Customer Service Centre GmbH]: on behalf of Cancer Research UK: [Springer] [21, 2012].
Based on the species prediction results from Figures 4 and 5, it can be concluded that water is rejected from the organic phase as the acid is extracted. When the nitric acid concentration in the aqueous phase is low, nitric acid and water are predominantly extracted by self-association of TBP. While more nitric acid is added to the aqueous phase, there is a marked increase in the formation of TBP monomer complexes (HNO3·TBP, HNO3·TBP·H2O) and a significantly decrease in TBP dimer complexes (HNO3·(TBP)2·H2O, (TBP)2·2H2O). This trend reflects that the weak complexes in the organic phase, composed of TBP with itself, are superseded by stronger ones with nitric acid.
4.2. UO2(NO3)2–H2O–TBP–Diluent System
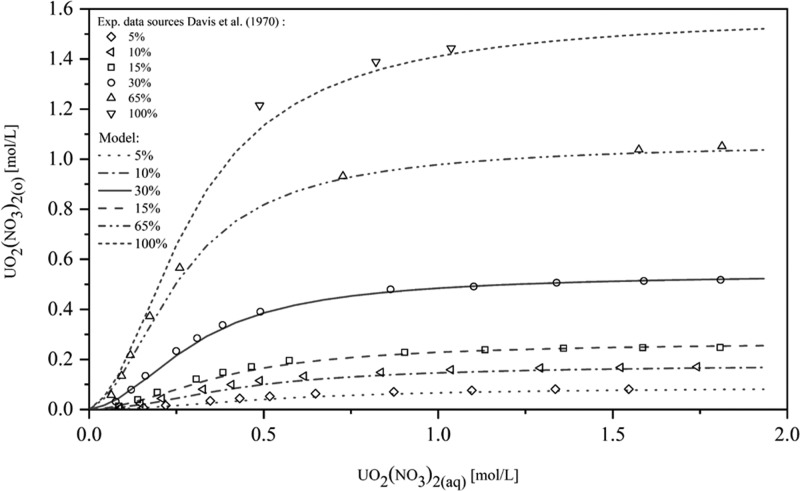
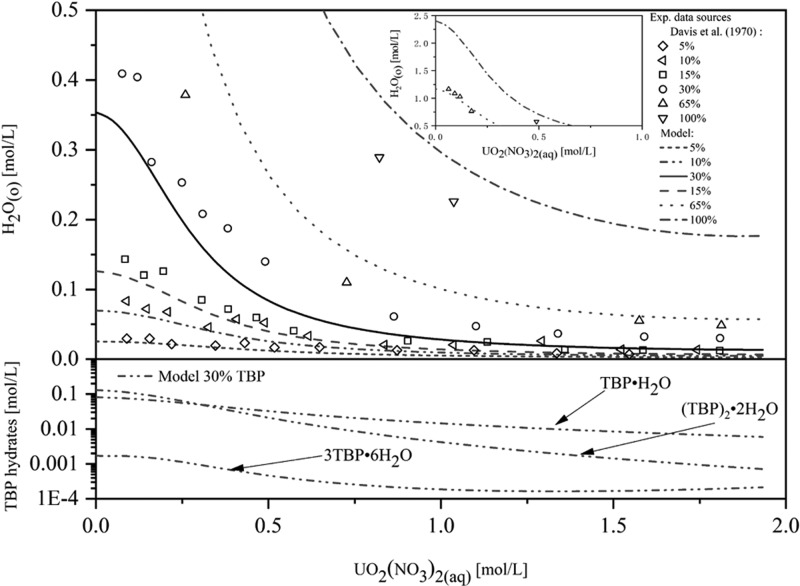
Figure 6 shows that the results are in good agreement with the experimental data for the extraction of uranyl nitrate in the range from 5 to 100 vol % TBP in the organic phase. The average absolute relative deviation (AARD) for UO2(NO3)2 extraction is 10.2%. It can be seen in Figure 7 that the model can predict the experimental data well for 5–30 vol % TBP. Even though the concentration of TBP increased to 60–100% causing an increase in the prediction deviation, its range still remained within an acceptable range.
Figure 6.
Comparison of the modeling for UO2(NO3)2 extraction for different TBP concentrations (5–100 vol % TBP) with literature data.3 Reprinted from ref (3), Copyright (1970), with permission from Elsevier.
Figure 7.
Comparison of the modeling of H2O extraction for different TBP concentrations (5–100 vol % TBP) with literature data3 and modeled speciation of TBP hydrates in the organic phase with 30 vol % TBP. Reprinted from ref (3), Copyright (1970), with permission from Elsevier.
4.3. UO2(NO3)2–HNO3–H2O–TBP–Diluent System
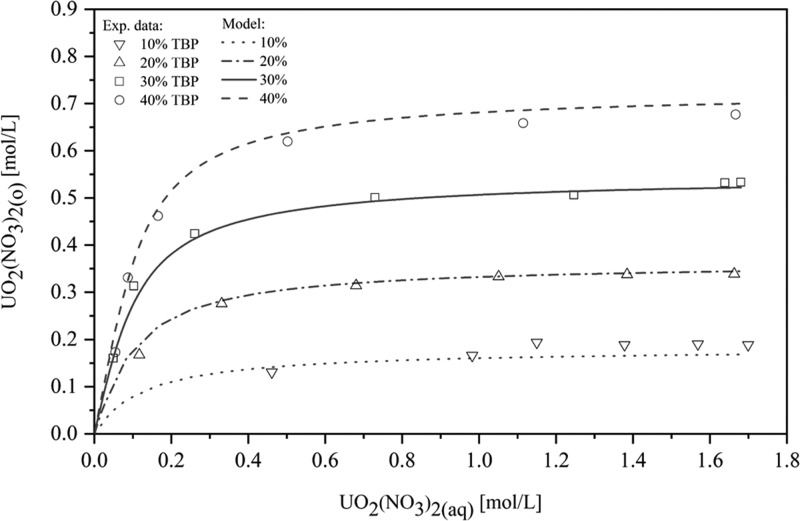
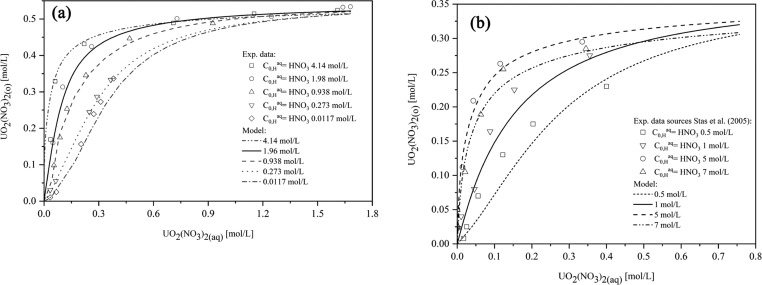
The extraction of UO2(NO3)2 in the UO2(NO3)2–HNO3–H2O–TBP–diluent system was evaluated using extraction data of our works. Figures 8 and 9 show that the predicted extraction isotherms show very good agreement with the experimental data for the range of 10–40 vol % TBP, from 0.0117 mol/L up to 4.14 mol/L HNO3 (AARD = 12.4%).
Figure 8.
Comparison of the modeling of UO2(NO3)2 extraction for different TBP concentrations (10-40 vol % TBP) from an aqueous solution containing 1.96 mol/L HNO3 with our works.
Figure 9.
Comparison of the modeling of UO2(NO3)2 extraction from an aqueous solution containing different HNO3 concentrations: (a) (0.0117–4.14 mol/L) for 30 vol % TBP with our works and (b) (0.5– 7 mol/L) for 20 vol % TBP with literature data.8 Reprinted with permission from ref (8). Copyright [2005] [Faculty of Chemical Technology and Biotechnology of the Budapest University of Technology and Economics].
Furthermore, Figure 9b shows an increase in uranyl nitrate extraction with the addition of nitric acid, while a further increase in the aqueous phase HNO3 concentration results in a decrease at high aqueous uranyl nitrate concentrations. This phenomenon is similar to the results reported by Stas et al.8 and Biswas et al.,32 which can be explained by the competitive extraction between nitric acid and uranyl nitrate.
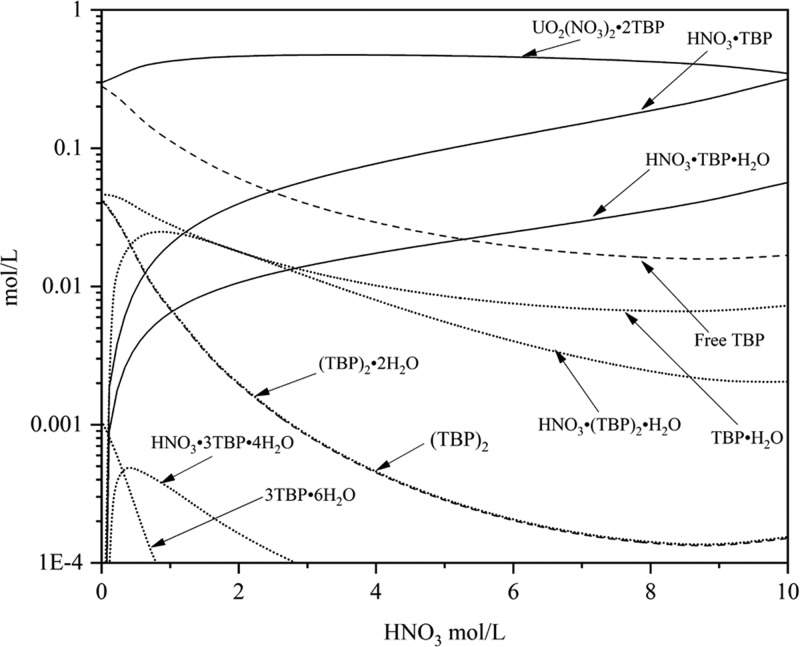
As Figure 10 shows, in a low range of nitric acid concentration, the existence of nitrate ions will promote the extraction reaction. As more nitric acid is added to the aqueous phase, free TBP decreases due to the association of HNO3 with TBP, which inhibits uranyl nitrate extraction.
Figure 10.
Modeled speciation in the organic phase as a function of acid concentration in the aqueous phase with 30 vol % TBP in the organic phase and 0.401 mol/L UO2(NO3)2 in the aqueous phase.
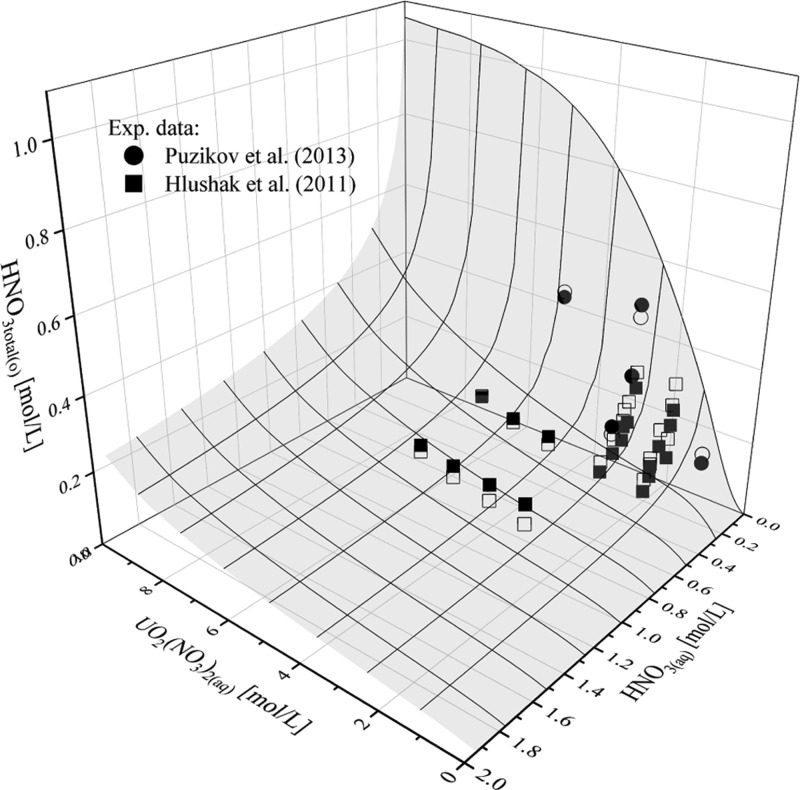
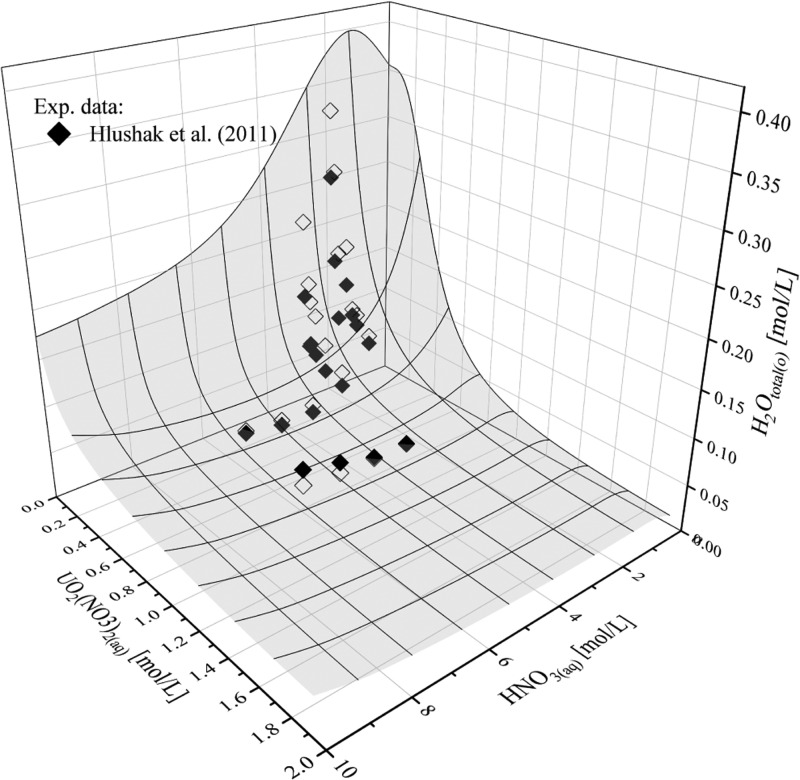
Comparisons of the total concentrations of HNO3 and H2O in the organic phase with experiment data of Hlushak et al.2 and Puzikov et al.22 for 30 vol %. TBP are shown in Figures 11 and 12. The results show that the model can successfully fit the experimental data. The AARD for HNO3 extraction in the UO2(NO3)2–HNO3–H2O–TBP–diluent system is 21.3% and for H2O extraction is 18.5%.
Figure 11.
Concentration of nitric acid in the organic phase with 30 vol % TBP, as a function of concentrations of nitric acid and uranyl nitrate in the aqueous phase: (■) = experimental data of Hlushak et al.,2 (●) = experimental data of Puzikov et al.,22 and (□) and (○) = corresponding results from the model. Reprinted from ref (2), Copyright (2011), with permission from Elsevier. Reprinted by permission from [Springer Nature Customer Service Centre GmbH]: on behalf of Cancer Research UK: [Springer] [22, 2013].
Figure 12.
Concentration of water in the organic phase with 30 vol % TBP, as a function of concentrations of nitric acid and uranyl nitrate in the aqueous phase: (◆) = experimental data of Hlushak et al.2 and (◇) = corresponding results from the model. Reprinted from ref (2), Copyright (2011), with permission from Elsevier.
Figure 13 shows the comparison of the predicted uranyl nitrate, nitric acid, and water extraction with experimental data. It can be seen that the model can successfully predict uranyl nitrate, nitric acid, and water extraction within AARDs of 11.2, 15.7, and 23.8% over a wide concentration range.
Figure 13.
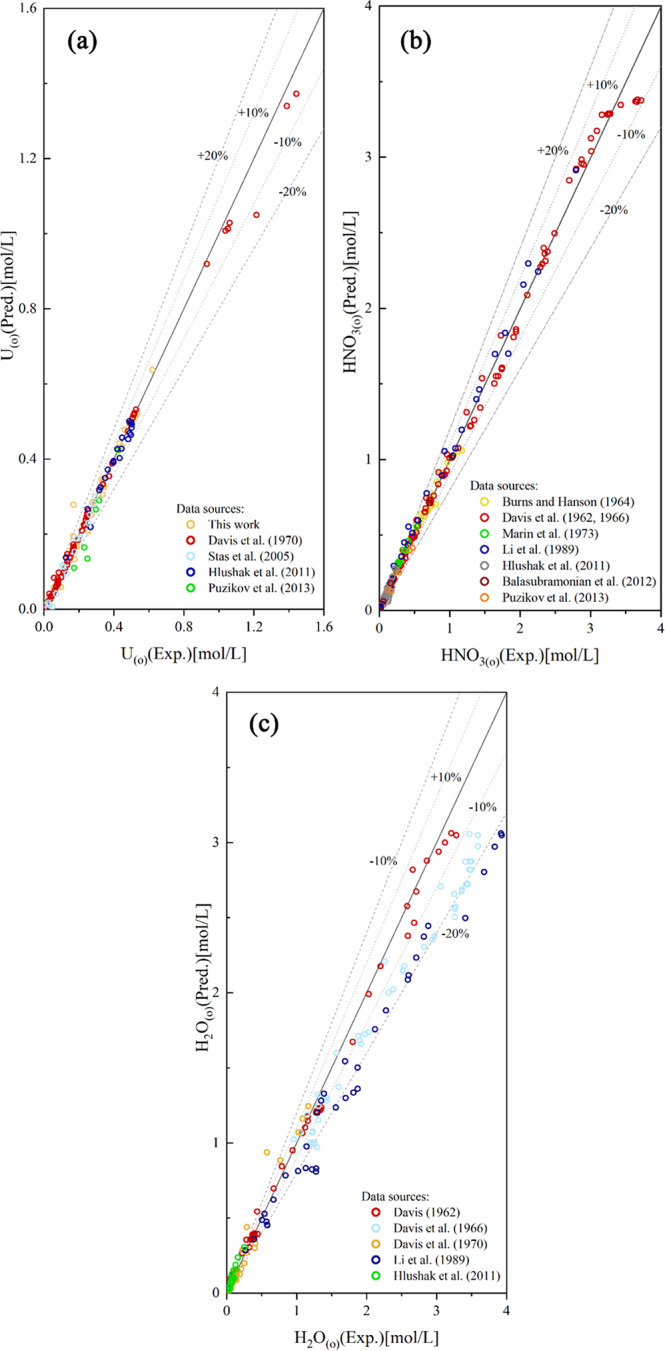
Predicted concentrations of uranyl nitrate (a), nitric acid (b), and water (c) in the organic phase using the model versus experimental results.2,3,14,17−22 Reprinted from ref (2), Copyright (2011), with permission from Elsevier. Reprinted from ref (3), Copyright (1970), with permission from Elsevier. Reprinted with permission from ref (8). Copyright [2005] [Faculty of Chemical Technology and Biotechnology of the Budapest University of Technology and Economics]. Reprinted with permission from ref (17). Copyright [1964] [John Wiley & Sons]. Reprinted with permission from ref (19). Copyright [1962] [Taylor & Francis]. Reprinted from ref (20), Copyright (1966), with permission form Elsevier. Reprinted by permission from [Springer Nature Customer Service Centre GmbH]: on behalf of Cancer Research UK: [Springer] [21, 2012]. Reprinted by permission from [Springer Nature Customer Service Centre GmbH]: on behalf of Cancer Research UK: [Springer] [22, 2013].
5. Conclusions
A generic model was developed for the extraction equilibrium prediction of the HNO3–H2O–TBP–diluent, UO2(NO3)2–H2O–TBP–diluent, and HNO3–UO2(NO3)2–H2O–TBP–diluent systems. The experimental data is predicted well by the model considering the competitive extraction between UO2(NO3)2 and HNO3. The main conclusions from this study are summarized as follows:
-
(i)
This generic model can be applied to represent experimental extraction isotherm data for HNO3–H2O–TBP–diluent within the full TBP concentration range, up to 10 mol/L HNO3, for the UO2(NO3)2–H2O–TBP–diluent system within the full TBP concentration range, and for the HNO3–UO2(NO3)2–H2O–TBP–diluent system within 10–40 vol % TBP and 0.01–7 mol/L HNO3.
-
(ii)
For water and nitric acid extraction, the main species are (TBP)2·2H2O and HNO3·(TBP)2·H2O at low nitric acid concentrations and TBP·H2O, HNO3·TBP·H2O, and HNO3·TBP at high acid concentration.
-
(iii)
The uranyl nitrate and nitric acid extraction prediction results show that uranyl nitrate is rejected from the organic phase due to the formation of HNO3·TBP and HNO3·TBP·H2O at high acid concentrations. This phenomenon confirms the existence of competitive equilibria in the HNO3–UO2(NO3)2–H2O–TBP–diluent extraction system.
Acknowledgments
The Science and Technology Service Network Initiative (KFJ-STS-QYZD-081), the National Key R&D Program of China (2019YFC1907700).
The authors declare no competing financial interest.
References
- Moyer B.; Baes C.; Case F.; Driver J. Liquid-liquid equilibrium analysis in perspective. II. complete model of water, nitric acid, and uranyl nitrate extraction by DI-2-ethylhexyl sulfoxide in dodecane. Solvent Extr. Ion Exch. 2001, 19, 757–790. 10.1081/SEI-100107024. [DOI] [Google Scholar]
- Hlushak S. P.; Simonin J. P.; Caniffi B.; Moisy P.; Sorel C.; Bernard O. Description of partition equilibria for uranyl nitrate, nitric acid and water extracted by tributyl phosphate in dodecane. Hydrometallurgy 2011, 109, 97–105. 10.1016/j.hydromet.2011.05.014. [DOI] [Google Scholar]
- Davis W.; Mrochek J.; Judkins R. R. Thermodynamics of the two-phase system: water-uranyl nitrate-tributyl phosphate-Amsco 125-82. J. Inorg. Nucl. Chem. 1970, 32, 1689–1702. 10.1016/0022-1902(70)80659-5. [DOI] [Google Scholar]
- Čomor J. J.; Kopečni M.; Petković D. A chemical model of the solvent extraction system: nitric acid-uranyl nitrate- water-tri-n-butyl phosphate (tbp)-diluent. Solvent Extr. Ion Exch. 1997, 15, 991–1006. 10.1080/07366299708934517. [DOI] [Google Scholar]
- Blaylock C. R.; Tedder D. W. Competitive equilibria in the system: water, nitric acid, tri-n-butyl phosphate, and Amsco 125-82. Solvent Extr. Ion Exch. 1989, 7, 249–271. 10.1080/07360298908962308. [DOI] [Google Scholar]
- Jové Colón C. F.; Moffat H. K.; Rao R. R. Modeling of Liquid-Liquid Extraction (LLE) Equilibria Using Gibbs Energy Minimization (GEM) for the System TBP-HNO3-UO2-H2O-Diluent. Solvent Extr. Ion Exch. 2013, 31, 634–651. 10.1080/00397911.2013.785882. [DOI] [Google Scholar]
- Puzikov E. A.; Zilberman B. Y.; Fedorov Y. S.; Blazheva I. V.; Kudinov A. S.; Goletskiy N. D.; Ryabkov D. V. A new approach to simulation of extraction equilibria in the purex process. Solvent Extr. Ion Exch. 2015, 33, 362–384. 10.1080/07366299.2014.993238. [DOI] [Google Scholar]
- Stas J.; Dahdouh A.; Shlewit H. Extraction of uranium (vi) from nitric acid and nitrate solutions by tributylphosphate/kerosene. Period. Polytech., Chem. 2005, 49, 3–18. [Google Scholar]
- Lum K. H.; Stevens G. W.; Perera J. M.; Kentish S. E. The modelling of ZnCl2 extraction and HCl co-extraction by TBP diluted in ShellSol 2046. Hydrometallurgy 2013, 133, 64–74. 10.1016/j.hydromet.2012.12.001. [DOI] [Google Scholar]
- Li Z.; Mumford K. A.; Smith K. H.; Chen J.; Wang Y.; Stevens G. W. Solution structure of isoactivity equations for liquid-liquid equilibrium calculations using the nonrandom two-liquid model. Ind. Eng. Chem. Res. 2016, 55, 2852–2859. 10.1021/acs.iecr.5b04469. [DOI] [Google Scholar]
- Naganawa H.; Tachimori S. Complex formation between tributyl phosphate and nitric acid and the hydration of the complexes in dodecane. Bull. Chem. Soc. Jpn. 1997, 70, 809–819. 10.1246/bcsj.70.809. [DOI] [Google Scholar]
- Čomor J. J.; ToliĆ A.; KopeČNi M.; PetkoviĆ D. Modeling of the simultaneous extraction of nitric acid and uranyl nitrate with tri-n-butyl phosphate. application to extraction operation. Sep. Sci. Technol. 1999, 34, 115–122. 10.1081/SS-100100640. [DOI] [Google Scholar]
- Davis W.; De Bruin H. J. New activity coefficients of 0–100 per cent aqueous nitric acid. J. Inorg. Nucl. Chem. 1964, 26, 1069–1083. 10.1016/0022-1902(64)80268-2. [DOI] [Google Scholar]
- Zongcheng L.; Tiezhu B.; Yuxing S.; Yigui L. Determination of the thermodynamic equilibrium constant of the extraction system HNO3-tributylphosphate (TBP)-n-C7H16. Fluid Phase Equilib. 1989, 46, 281–293. 10.1016/0378-3812(89)80041-X. [DOI] [Google Scholar]
- Goldberg R. N. Evaluated activity and osmotic coefficients for aqueous solutions: bi-univalent compounds of lead, copper, manganese, and uranium. J. Phys. Chem. Ref. Data 1979, 8, 1005–1050. 10.1063/1.555611. [DOI] [Google Scholar]
- Ochkin A. V.; Gladilov D.; Nekhaevskiy S.; Merkushkin A. Activity coefficients of uranyl nitrate and nitric acid in aqueous mixtures. Procedia Chem. 2016, 21, 87–92. 10.1016/j.proche.2016.10.013. [DOI] [Google Scholar]
- Burns P. E.; Hanson C. Distribution of nitric acid between tri-n-butyl phosphate and water. J. Appl. Chem. 1964, 14, 117–121. 10.1002/jctb.5010140304. [DOI] [Google Scholar]
- Marin B.; Sellier J.-Y.; Gourisse D. Etude de la competition entre l’acide nitrique et l’acide nitreux dans les extractions par le phosphate de tributyle. J. Inorg. Nucl. Chem. 1973, 35, 2907–2915. 10.1016/0022-1902(73)80522-6. [DOI] [Google Scholar]
- Davis W. Thermodynamics ofextraction of nitric acid by tri-n-butyl phosphate–hydrocarbon diluent solutions: I. Distribution studies with TBP in amsco 125-82 at intermediate and low acidities. Nucl. Sci. Eng. 1962, 14, 159–168. 10.13182/NSE62-A28115. [DOI] [Google Scholar]
- Davis W.; Mrochek J.; Hardy C. J. The system: tri-n-butyl phosphate (TBP)-nitric acid-water—I activities of tbp in equilibrium with aqueous nitric acid and partial molar volumes of the three components in the tbp phase. J. Inorg. Nucl. Chem. 1966, 28, 2001–2014. 10.1016/0022-1902(66)80292-0. [DOI] [Google Scholar]
- Balasubramonian S.; Srivastav R. K.; Kumar S.; Sivakumar D.; Sinha P. K.; Sampath M.; Kamachi Mudali U. Speciation of 30% tri-n-butyl phosphate solvent during extraction of nitric acid. J. Radioanal. Nucl. Chem. 2013, 295, 1703–1707. 10.1007/s10967-012-1984-7. [DOI] [Google Scholar]
- Puzikov E. A.; Blazheva I. V.; Zilberman B. Y.; Fedorov Y. S.; Kudinov A. S.; Ryabkova N. V.; Sysoeva A. V.; Goletskii N. D.; Biragova Y. V.; Shadrin A. Y. Extraction of nitric acid and uranyl nitrate with tributyl phosphate in diluent in the presence of salting-out agents and its mathematical description. Radiochemistry 2013, 55, 369–376. 10.1134/S106636221304005X. [DOI] [Google Scholar]
- Ochkin A. V.; Merkushkin A. O.; Nekhaevskii S. Y.; Gladilov D. Y. Modeling of the activities of uranyl nitrate and nitric acid in mixed solutions. Radiochemistry 2018, 60, 534–540. 10.1134/S1066362218050107. [DOI] [Google Scholar]
- Li Z. C.; Chen J.; Bao T. Z.; Shang Y. X.; Li Y. G. Prediction of phase equilibria in tributyl phosphate extraction system using the unifac group contribution method. Thermochim. Acta 1990, 169, 287–300. 10.1016/0040-6031(90)80155-R. [DOI] [Google Scholar]
- Marion G. M. A molal-based model for strong acid chemistry at low temperatures (<200 to 298 K). Geochim. Cosmochim. Acta 2002, 66, 2499–2516. 10.1016/S0016-7037(02)00857-8. [DOI] [Google Scholar]
- Kim H.; Frederick W. Evaluation of pitzer ion interaction parameters of aqueous-electrolytes at 25-degrees-c .1. Single salt parameters. J. Chem. Eng. Data 1988, 33, 177–184. 10.1021/je00052a035. [DOI] [Google Scholar]
- Chaiko D.; Vanderift G. A thermodynamic model of nitric-acid extraction by tri-normal-butyl phosphate. Nucl. Technol. 1988, 82, 52–59. 10.13182/NT88-A34116. [DOI] [Google Scholar]
- Roddy J. W. Interactions in the tri-n-butyl phosphate-water-diluent system. J. Inorg. Nucl. Chem. 1978, 40, 1787–1791. 10.1016/0022-1902(78)80226-7. [DOI] [Google Scholar]
- Mokili B.; Poitrenaud C. Modeling of nitric-acid and water extraction from aqueous-solutions containing a salting-out agent by tri-n-butylphosphate. Solvent Extr. Ion Exch. 1995, 13, 731–754. 10.1080/07366299508918300. [DOI] [Google Scholar]
- Kopečni M. M.; Petković D. M. A chemical-model of the solvent-extraction system-water-uranyl nitrate nitric-acid tri-n-butyl phosphate diluent. J. Chem. Soc., Dalton Trans. 1994, 56, 2209–2212. 10.1039/DT9940002209. [DOI] [Google Scholar]
- Balasubramonian S.; Sinha P.; Sivakumar D.; Mishra A. K.; Sampath M.; Pandey N. K.; Kumar S. Modeling of simultaneous extraction of uranyl nitrate and nitric acid by 36 vol.% tri-iso-amyl phosphate in n-dodecane. J. Radioanal. Nucl. Chem. 2017, 314, 975–983. 10.1007/s10967-017-5474-9. [DOI] [Google Scholar]
- Biswas S.; Singh D. K.; Hareendran K. N.; Sharma J. N.; Roy S. B. Extraction behavior of U(IV) from nitric acid medium using di-isodecyl phosphoric acid dissolved in dodecane. J. Radioanal. Nucl. Chem. 2010, 284, 201–205. 10.1007/s10967-010-0468-x. [DOI] [Google Scholar]


