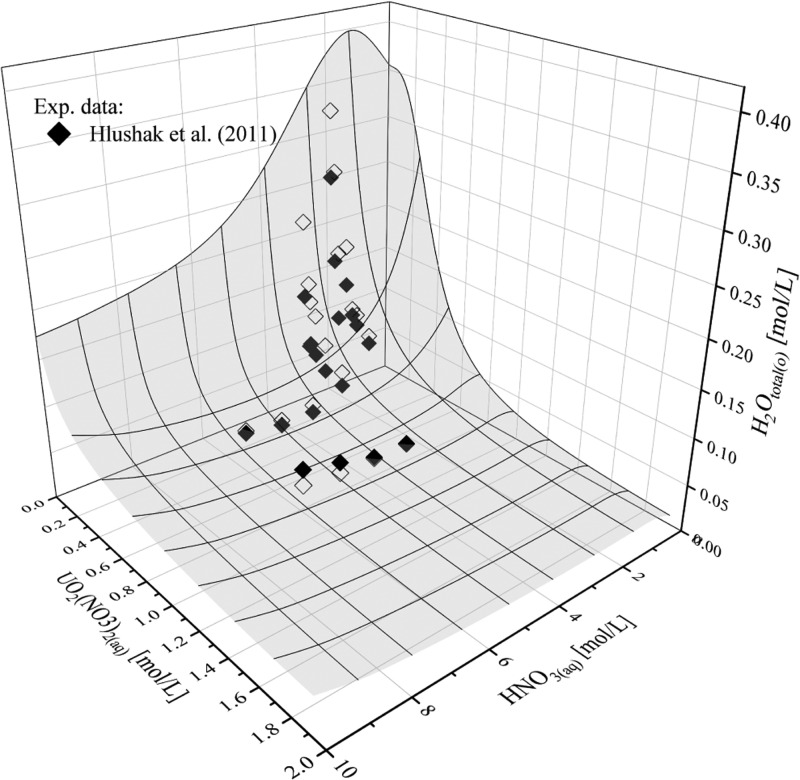
Figure 12.
Concentration of water in the organic phase with 30 vol % TBP, as a function of concentrations of nitric acid and uranyl nitrate in the aqueous phase: (◆) = experimental data of Hlushak et al.2 and (◇) = corresponding results from the model. Reprinted from ref (2), Copyright (2011), with permission from Elsevier.

