
Figure 4.
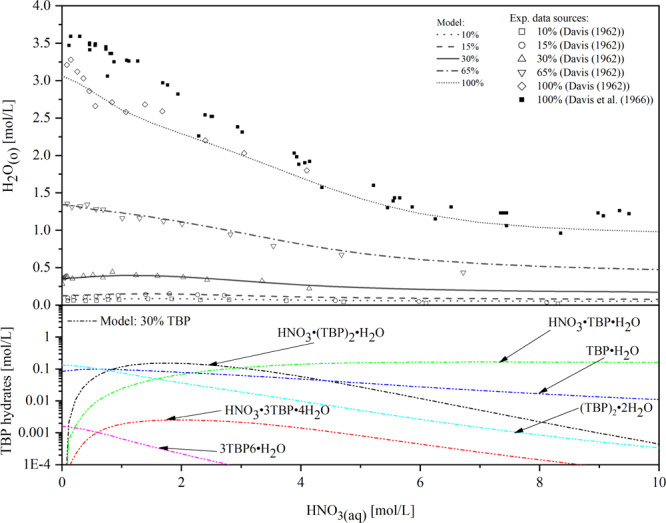
Comparison of the modeling of H2O extraction for different TBP concentrations (10–100 vol % TBP) with literature data19,20 and modeled speciation of TBP hydrates in the organic phase with 30 vol % TBP. Reprinted with permission from ref (19). Copyright [1962] [Taylor & Francis]. Reprinted from ref (20), Copyright (1966), with permission form Elsevier.