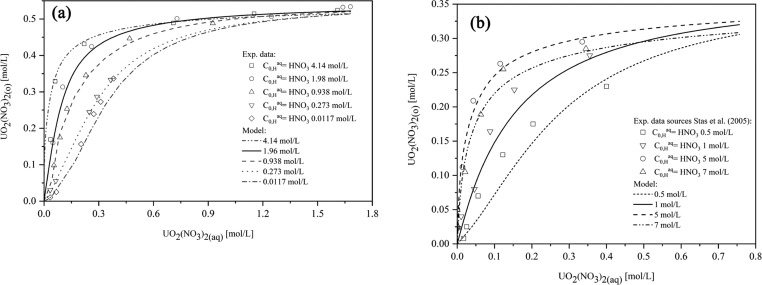
Figure 9.
Comparison of the modeling of UO2(NO3)2 extraction from an aqueous solution containing different HNO3 concentrations: (a) (0.0117–4.14 mol/L) for 30 vol % TBP with our works and (b) (0.5– 7 mol/L) for 20 vol % TBP with literature data.8 Reprinted with permission from ref (8). Copyright [2005] [Faculty of Chemical Technology and Biotechnology of the Budapest University of Technology and Economics].

