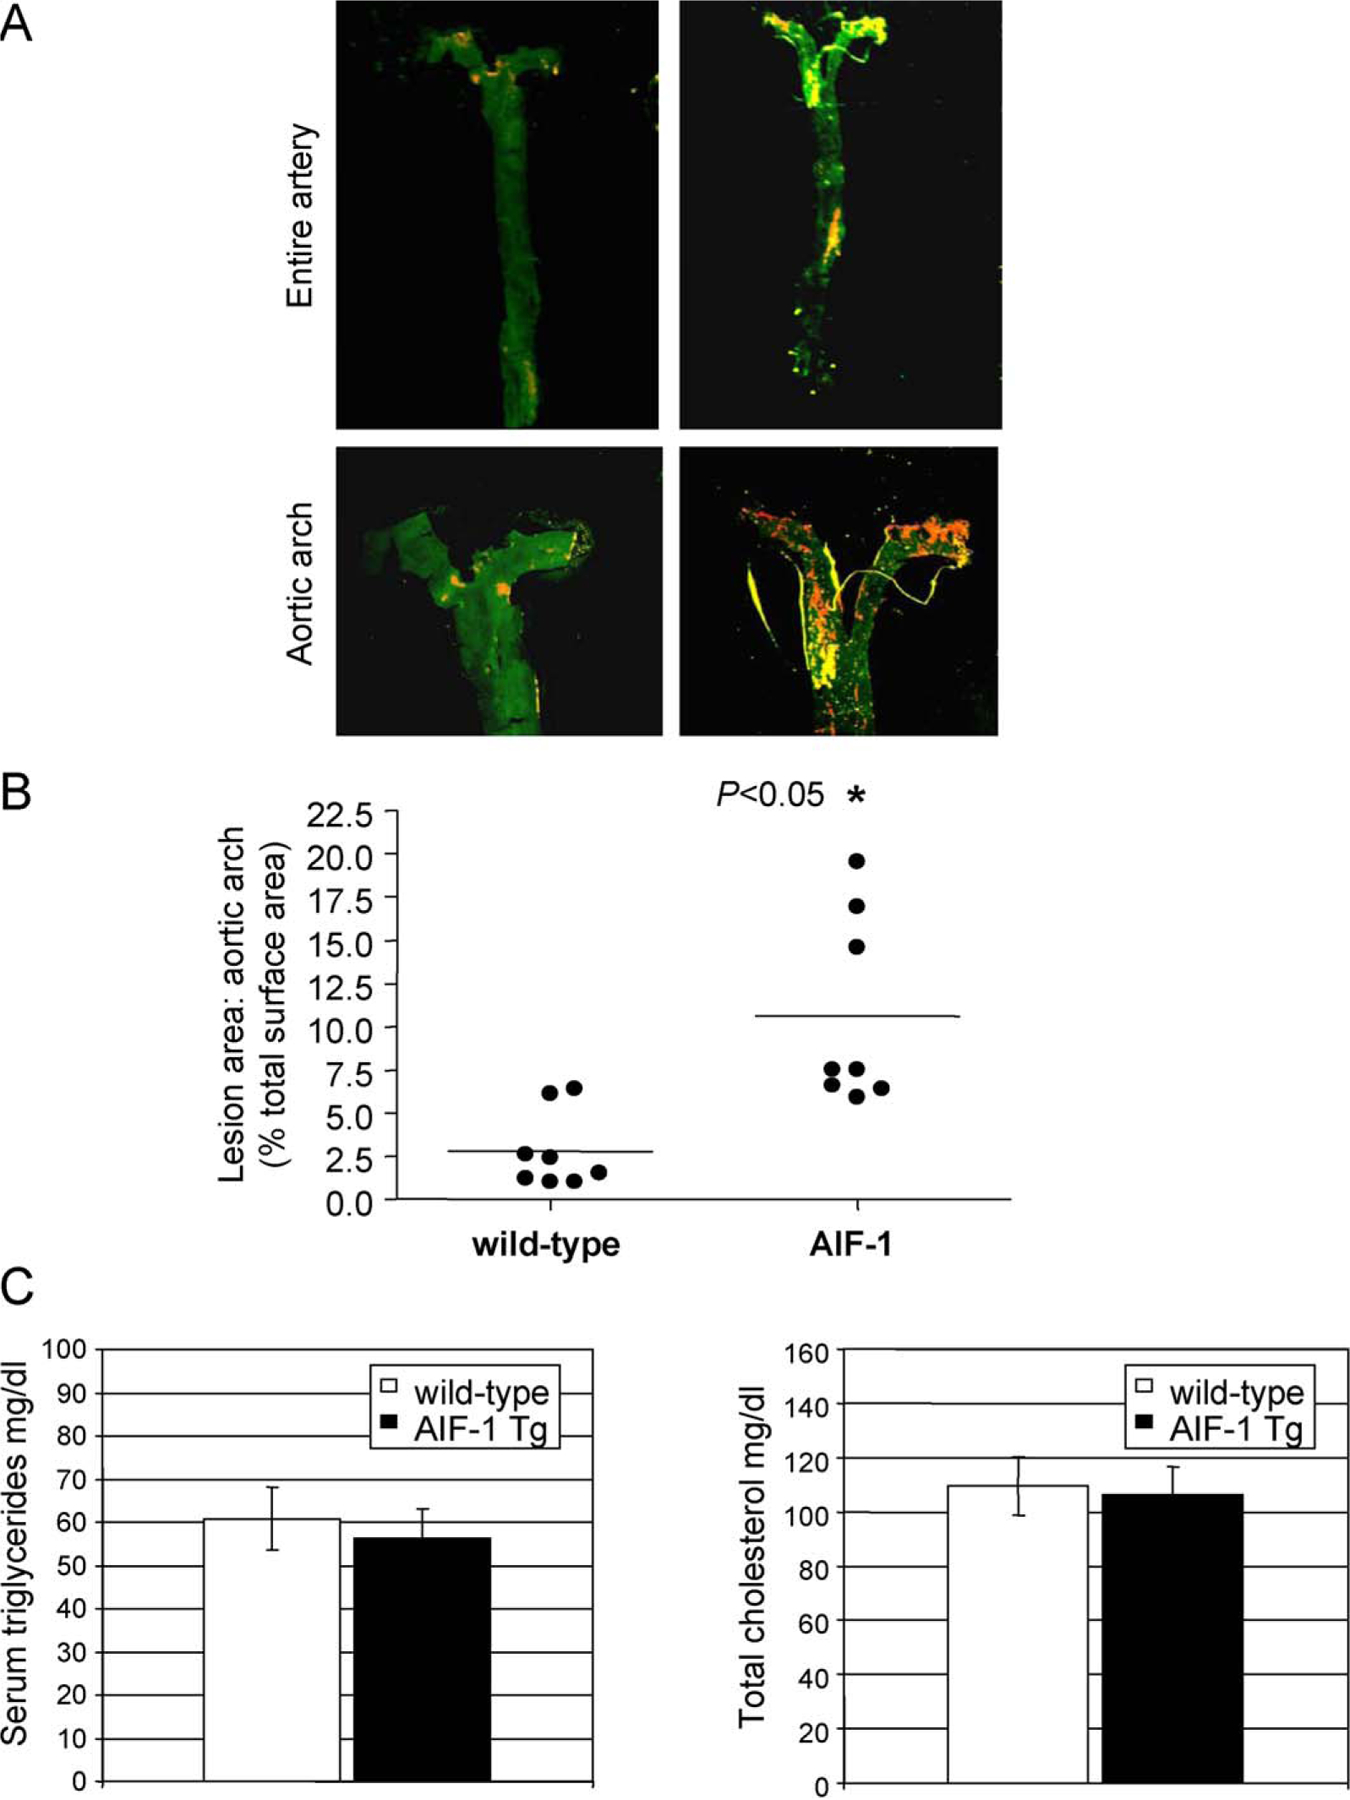
Fig. 2.

AIF-1 expression increases atherosclerosis. (A) Representative pseudo-colored photographs of Sudan IV stained abdominal aorta and higher magnification of aortic arch. Yellow and orange areas represent atherosclerotic lesions. (B) Quantification of lesion size. Age and sex-matched littermates were fed atherogenic diet for 16 weeks, and lesion size quantified by en face staining. P < 0.05 transgenic vs. wild-type littermates, n = 8. (C) Lipoprotein profiles do not differ between AIF-1 Tg and wild-type mice. Serum triglyceride and total cholesterol levels of AIF-1 Tg and WT mice. Differences between age and sex-matched groups were not significant for either lipid product. Triglyceride P = 0.3, cholesterol P = 0.8 (n = 8 per group). (For interpretation of the references to color in this figure legend, the reader is referred to the web version of the article.)
