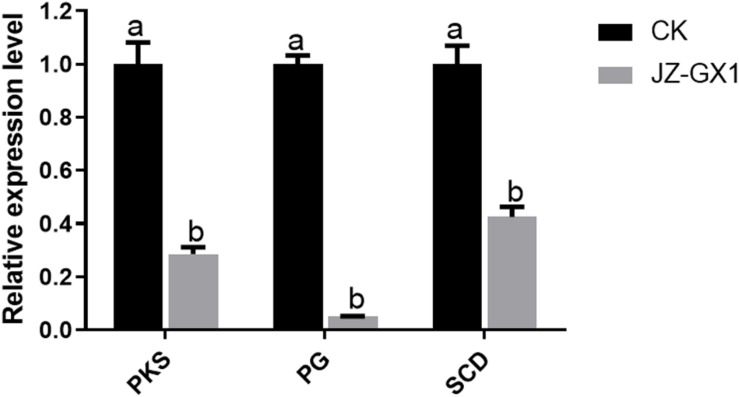
FIGURE 4.
Relative expression of pathogenicity-related genes in C. gloeosporioides treated with R. aquatilis JZ-GX1 VOCs. The vertical bars represent the standard deviation of the average. One-way ANOVA analysis was performed and Duncan’s post hoc test was applied. Different letters indicate statistically significant differences (p < 0.05) among treatments.

