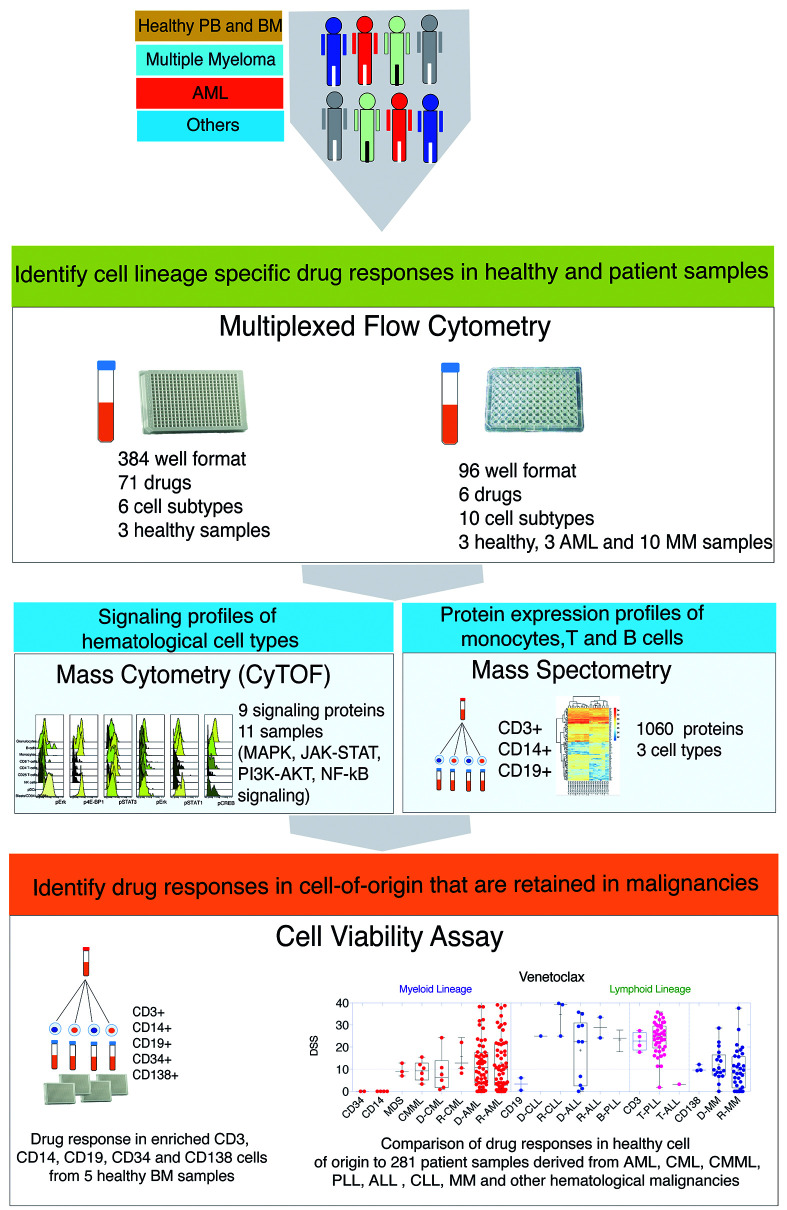
Figure 1.
Overview of the study. Schematic diagram summarizing the study design, datasets and analytical framework of the study. Bone marrow (BM) and peripheral blood (PB) samples from both healthy individuals and cancer patients were subjected to drug sensitivity assessment. Single cell drug sensitivity assay using the iQue® Screener PLUS flow cytometer was performed in 96-and 384-well plates to monitor drug effects on ten and six hematopoietic cell subtypes, respectively. Immunophenotypic details and cellular proportions of the analyzed cell types are provided in Online Supplementary Figure S1A-D, Figure S2 and Online Supplementary Table S3, respectively. 71 drugs in 384-well plates and six drugs in 96-well plates were tested. Proteomic analysis was performed on three cell subsets (monocytes, T and B cells) from two healthy individuals and four myeloma patients. Basal phosphorylation of nine signaling proteins involved in MAPK, JAK-STAT, PI3K-AKT-mTOR and NF-κB signaling was monitored in 14 samples. Healthy BM samples from four healthy individuals were subjected to CD34, CD3, CD14, CD19 and CD138 cell enrichment and tested against 71 small molecules with cell viability as the end point readout using the CellTiter-Glo® assay. A comparison of ex vivo drug response in healthy and corresponding malignant cell types was performed for six drugs in 281 primary patient samples representing different hematologic malignancies. Samples included both published and unpublished datasets from chronic myeloid leukemia (CML, n=13),11,12, chronic myelomonocytic leukemia (CMML, n=11),12 myelodysplastic syndromes (MDS, n=4), acute myeloid leukemia (AML, n=145),9,12 B-cell acute lymphoblastic leukemia (BALL, n=14),13 chronic lymphocytic leukemia (CLL, n=4),12 T-cell prolymphocytic leukemia (T-PLL, n=40),14 multiple myeloma (MM, n=50),15 and other hematologic malignancies (n=6). PLL: prolymphocytic leukemia.

