Figure 6.
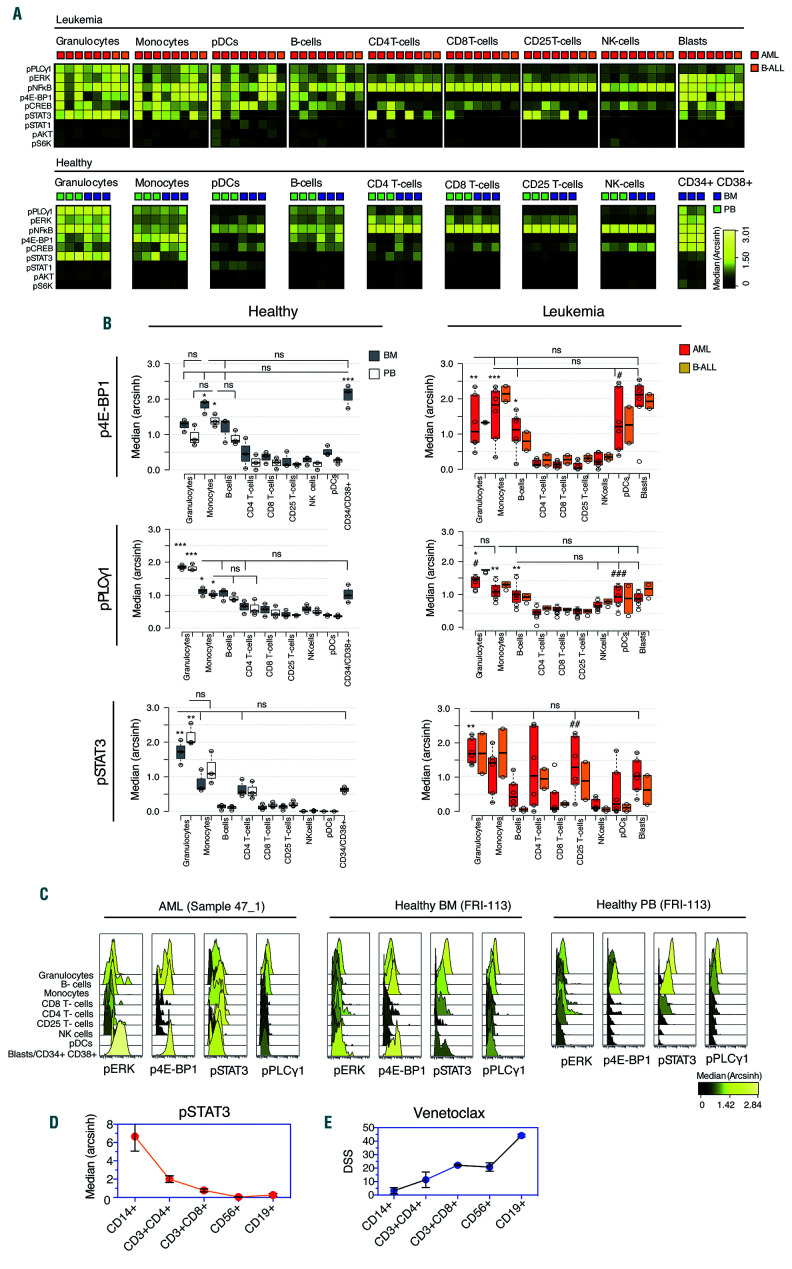
Mass cytometry (CyTOF) profiling of basal signaling patterns in nine healthy cell subsets. (A) Summary of the basal phosphorylation state of 9 signaling proteins associated with NF-κB, PI3K-AKT-mTOR (AKT, 4E-BP1, PLCG1 and p70-S6K), JAK-STAT (STAT1 and STAT3), MAPK (ERK and CREB) in three healthy individuals. Matched peripheral blood (PB) and bone marrow (BM) from the same healthy donors were profiled. Phosphorylation profiles for the indexed phosphoproteins were investigated in corresponding cell subsets in leukemic samples: acute myeloid leukemia (AML) and B-cell acute lymphoblastic leukemia (B-ALL). (B) Box plot representation of population medians of p4EBP1, pPLCg1 and pSTAT in healthy PB and BM (left) and leukemic samples (right). Center lines of boxes show medians; box limits indicate the 25th and 75th percentiles as determined by R software; whiskers extend 1.5 times the interquartile range from the 25th and 75th percentiles, outliers are represented by dots; data points are plotted as open circles. *Significant difference (two-way ANOVA, Tukey’s HSD) between all corresponding populations, unless specified as not significant (ns). #Significance between AML and the corresponding healthy populations in both PB and BM. There were no significant differences between PB and BM in any population for each of the measured phosphoproteins, *P<0.05, **P<0.005, ***P<0.0005. Healthy PB and BM (n=3), AML (n=6), B-ALL (n=2). (C) Stacked histogram representations of pERK, p4E-BP1, pSTAT3 and pPLCg1 phosphorylation status across cell types in an AML patient and healthy donor samples (paired BM and PB). Immunophenotype of the presented samples are provided in Online Supplementary Figure S1B. (D) Phosphorylation of STAT3 in five healthy cell types from three healthy individuals presented as mean±standard error of mean (SEM) arcsinh values derived from mass cytometry analysis. (E) Venetoclax response in cell types displayed as SEM of drug sensitivity score (DSS) values for three healthy donors. A higher response to venetoclax correlated with reduced phosphorylation of STAT3. PDC: plasmacytoid dendritic cells; NK: natural killer.

