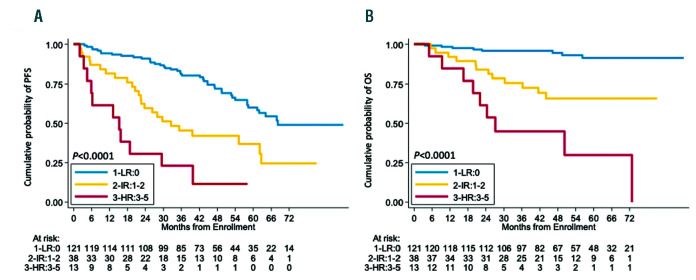
Figure 5.
The “MIPI-g” model. Kaplan-Meier estimates of (A) progression free survival (PFS) and (B) overall survival (OS) of patients harboring KMT2D mutations and/or TP53 disruption (mutations and/or deletions) integrated into the MIPI-c. Low MIPI-g risk cases are represented by the blue line, intermediate MIPI-g cases by the yellow line and high MIPI-g cases by the red line. The Log-rank statistics P-values are indicated for adjacent curves.

