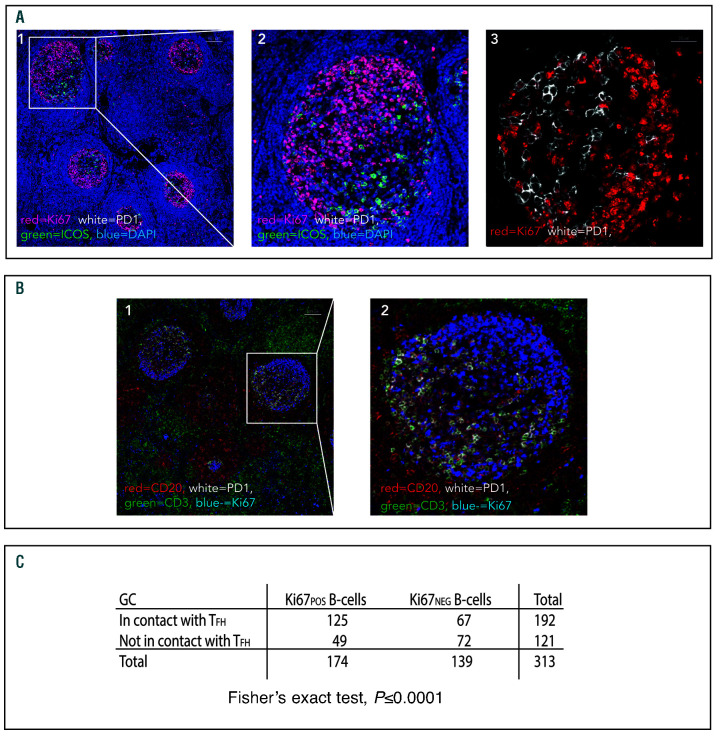
Figure 2.
Close physical association between Ki67pos B cells and follicular helper T cells in normal germinal center light zones. (A1) Representative low power image showing polarization of Ki67pos cells to the dark zones of normal germinal centers. Ki67 (red), PD-1 (white), ICOS (green), DAPI (blue). Scale bar represents 100 μm. The area highlighted by the white rectangle is shown in high power in (A2). (A3) The close association between Ki67pos FL cells (red) and PD-1Hi cells (white) is shown in the light zone of another follicle whereas in the dark zone there is less interaction between Ki67pos cells and PD-1Hi T cells. The scale bar represents 25 μm. (B1) Using a different four-color panel, the Ki67pos cells (blue) were confirmed as CD20pos B cells (red) and the PD-1Hi cells (white) were confirmed as CD3pos T cells (green). The scale bar represents 100 μm and the area highlighted by the white rectangle has been magnified in (B2). Images representative of n=13 images from n=4 reactive lymph node (LN) samples. (C) Contingency table showing that Ki67pos B cells are significantly more likely to be in contact with follicular helper T cells (TFH) than Ki67neg B cells in normal germinal center (GC) light zones, as quantified by manual visual assessment. For all samples analyzed together (n=5, Fisher’s exact test P<0.0001).

