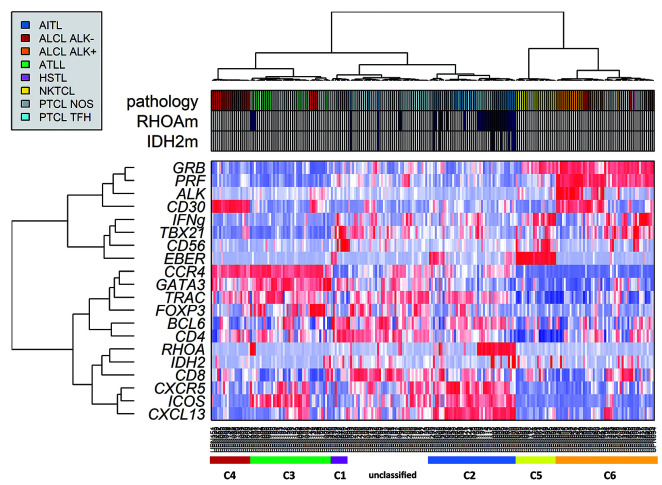
Figure 3.
Unsupervised hierarchical clustering of peripheral T-cell lymphomas (PTCL) including PTCL-not otherwise specified (NOS) (n=230). PTCL-NOS distributed among six defined clusters represented by colored bars under the heat map (from left to right): C1 (red), C2 (green), C3 hepatosplenic T-cell lymphoma (HSTL) (purple), C4 angioimmunoblastic T-cell lymphomas AITL/TFH-derived PTCL (blue and light blue), C5 natural killer (NK)-TCL (yellow), and “cytotoxic anaplastic large cell lymphomas (ALCL)” (orange and red). The 77 PTCL-NOS (gray in Pathology) are distributed among the subgroups.

