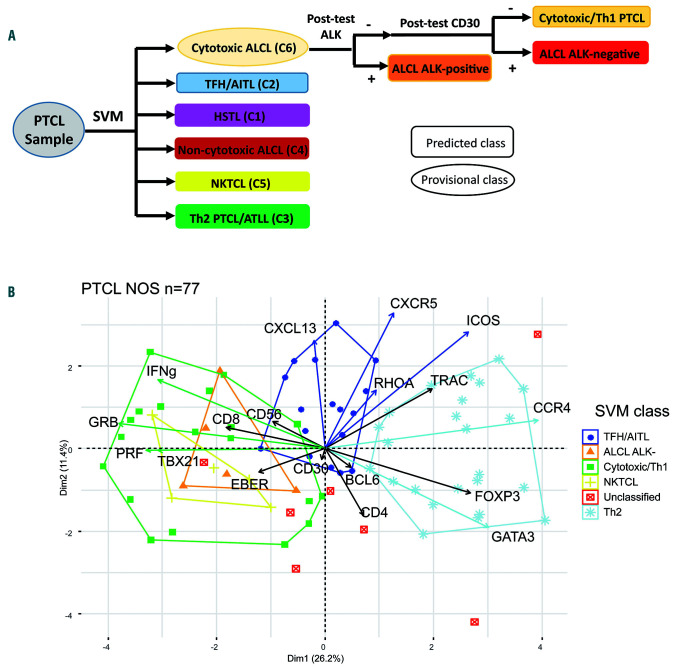
Figure 4.
Bioinformatic model for the analysis of reverse transcriptase-multiplex ligation-dependent probe amplification (RT-MLPA) data. (A) The support vector machine (SVM) model attributes a predicted (rectangle) or provisional (oval) class for each peripheral T-cell lymphoma (PTCL) sample. Post-tests based on ALK and CD30 were designed to distinguish between the subgroups in the heterogeneous “cytotoxic/ALCL-like” category. (B) principal component analysis (PCA) plot of the SVM classification for PTCL-not otherwise specified (NOS) (n=77) showed three main molecular categories among: TFH/angioimmunoblastic T-cell lymphomas (AITL) (blue), Th2 (light blue), and cytotoxic/Th1 (green). The latter also comprised NKTCL-like (yellow) and anaplastic large cell lymphomas (ALCL)-like (orange) subgroups. Seven cases were unclassified (red).

