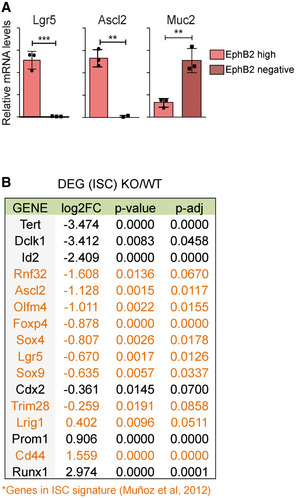
Figure EV2. IκBα KO intestines showed alterations in ISC population.

- qPCR analysis of EphB2‐high and EphB2‐negative sorted cells from P6 WT intestine. Three technical replicates were analyzed. Bars represent mean values ± standard error of the mean (s.e.m.); P values were derived from an unpaired t‐test, two‐tailed, ***P‐value < 0.0005, **P‐value < 0.005.
- Table indicating the ISC genes differentially expressed between IκBα WT and KO EphB2‐high sorted cells (RNA‐seq, n = 3 WT and n = 3 KO), including genes of ISC signature 43 (in orange).
