-
A
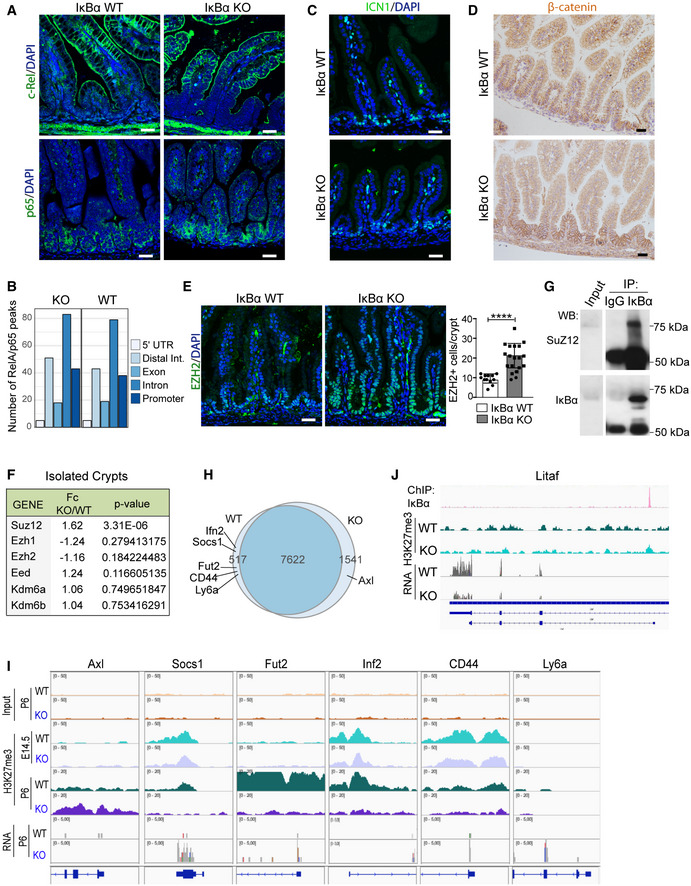
IF analysis of c‐Rel and RelA/p65 in P6 WT and IκBα KO intestines.
-
B
Number of peaks from p65 ChIP‐sequencing analysis associated with the different genomic localizations was obtained merging two biological replicates per condition (
n = 2 P6 WT and
n = 2 P6 IκBα KO intestinal crypt cells). Data from individual experiments have been deposited at
GSE131187.
-
C, D
IF analysis of active Notch1 (ICN1) (C) and β‐catenin (D) in the indicated IκBα backgrounds at P6 intestines.
-
E
IF analysis of the PRC2 protein EZH2 and quantification of the EZH2‐positive cells per crypt in n = 3 P6 animals per genotype were analyzed (a minimum of 15 crypts was counted per genotype). Bars represent mean values ± standard error of the mean (s.e.m.); P values were derived from an unpaired t‐test, two‐tailed, ****P‐value < 0.0001.
-
F
Table indicating the methylation‐related genes (PRC2 members and KDM6 demethylase) differentially expressed between IκBα WT and KO EphB2‐high sorted cells (RNA‐seq).
-
G
Western blot analysis of IκBα IP from crypt nuclear extracts.
-
H
Venn diagram representing the distribution of genes detected as differentially methylated in the H3K27me3 ChIP‐sequencing analysis across P6 IκBα genotypes (n = 2 WT and n = 2 KO mice).
-
I
Representation of H3K27me3 distribution at embryonic E14.5 (n = 2 WT and n = 2 KO mice) and postnatal P6 (n = 2 WT and n = 2 KO mice) (from ChIP‐sequencing) and expression levels (from RNA‐sequencing) in the genomic region of the indicated fetal ISC genes.
-
J
Representation of IκBα (n = 4) and H3K27me3 (n = 2) distribution (from ChIP‐sequencing) and expression levels (from RNA‐sequencing) in the genomic region of Litaf.
Data information: Scale bars in A, C, D, and E, 25 μm.

