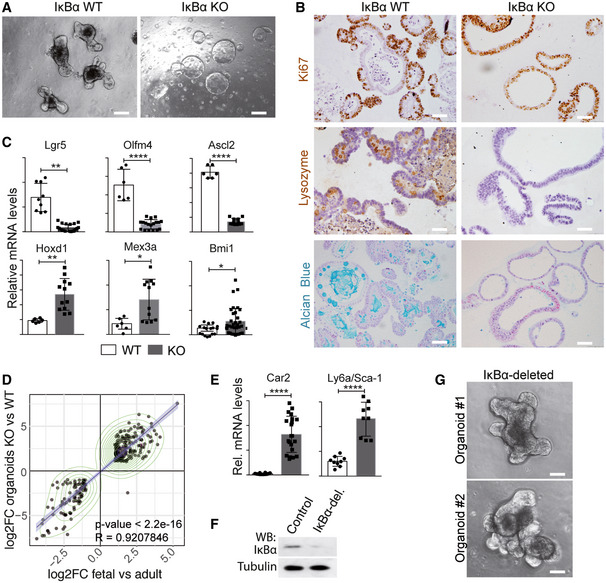
Representative stereoscopic images of P6 WT and IκBα KO‐derived intestinal organoids.
IHC analysis with the indicated antibodies and Alcian Blue staining of WT and IκBα KO‐derived organoids.
qPCR analysis of the indicated ISC genes in WT and IκBα KO‐derived organoids.
Correlation plots of the indicated differentially expressed gene (DEG) sets obtained in expression microarray (5 technical replicates of a minimum of two organoids per genotype were analyzed). Values for DEG in fetal and adult organoids were obtained from
23.
qPCR analysis of the indicated fetal genes in WT and IκBα KO‐derived organoids.
Western blot analysis of control and IκBα‐deleted organoids using CRISPR‐Cas9 technology.
Representative stereoscopic images of WT and IκBα‐deleted organoids.
Data information: In C and E, 3 technical replicates of a minimum of two organoids per genotype were analyzed Bars represent mean values ± standard error of the mean (s.e.m.).
P values were derived from an unpaired
t‐test, two‐tailed, ****
P‐value < 0.0001, **
P‐value < 0.005, *
P‐value < 0.05. Scale bars in A, 100 μm, and in B and G, 50 μm.

