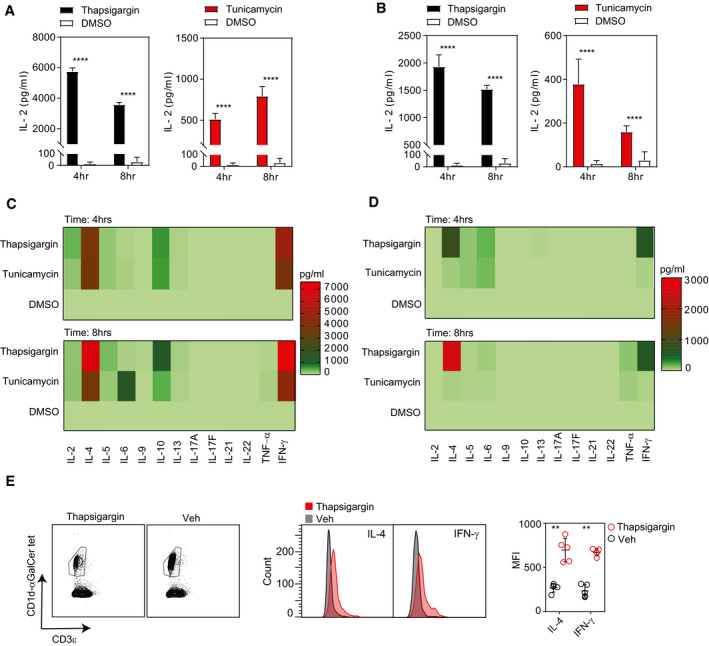
Figure 1. iNKT cell activation by antigen‐presenting cells undergoing UPR.

-
A, BBar graph represents IL‐2 secretion by NKT cell hybridoma (2C12) co‐cultured with (A) a murine macrophage cell line (J774.2) or with (B) a human macrophage cell line (U937) treated with either thapsigargin (black bars), tunicamycin (red bars) or DMSO (white bars). Graphs show mean ± SEM from n = 3 biological replicates. ****P < 0.0001 (unpaired t‐test).
-
C, DThe heat map represents cytokine secretion by in vitro expanded (C) murine splenic iNKT cells or (D) human peripheral blood iNKT cells co‐cultured either with thapsigargin‐ or tunicamycin‐ or DMSO‐treated murine BMDMs. The heat map shows the average result of two pooled biological replicates.
-
EWild‐type C57BL/6 mice were injected intravenously with thapsigargin‐loaded PLGA nanoparticles or vehicle, and 12 h later, hepatic iNKT cells were analysed by flow cytometry. Histograms represent expression of intracellular IL‐4 and IFN‐γ levels in hepatic iNKT cells from mice injected with thapsigargin‐loaded PLGA nanoparticles (red histogram) or vehicle‐treated (grey histogram) mice. Dot plots represent MFI for intracellular IL‐4 and IFN‐γ expression in hepatic iNKT cells from thapsigargin‐loaded PLGA nanoparticles (red dots) or vehicle‐treated (black dots) mice. Data plots show mean ± SEM from n = 5 mice per group. **P ≤ 0.001 (Mann–Whitney U‐test).
Source data are available online for this figure.
