
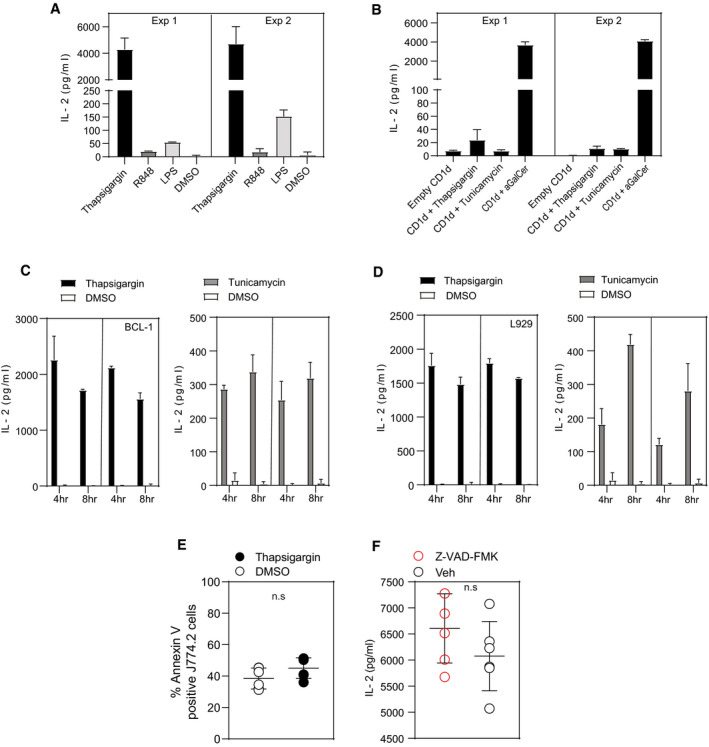
Figure EV1. Induction of UPR in diverse APCs is associated with iNKT activation.
-
ABar graph represents IL‐2 secretion by 2C12 NKT hybridoma upon co‐culture with J774.2 treated with either thapsigargin, R848, LPS or DMSO. Co‐culture with thapsigargin‐treated J774.2 cells resulted in significant increase of IL‐2 secretion by 2C12, whereas R848‐ or LPS‐treated J774.2 cells induced small increases or negligible levels of IL‐2 secretion by 2C12 when compared to DMSO controls. In total, n = 2 biological replicates were performed (two technical replicates per biological replicate). Graphs show mean ± SEM of each biological replicate.
-
BIL‐2 secretion by 2C12 is not due to the direct activation of 2C12 cells by either thapsigargin or tunicamycin. In total, n = 2 biological replicates were performed (two technical replicates per biological replicate). Graphs show mean ± SEM of each biological replicate.
-
C, DIL‐2 secretion by NKT cell hybridoma 2C12 is not restricted to macrophages undergoing UPR but also occurs in diverse APCs such as murine Bcl‐1 and L929 cell lines. In total, n = 2 biological replicates were performed (two technical replicates per biological replicate). Graphs show mean ± SEM of each biological replicate.
-
EDot plot represents little or no significant difference in the induction of apoptosis by thapsigargin (50 nM) treatment in J774.2 cells when compared to DMSO treatment. Graphs show mean ± SEM from n = 3 biological replicates (two technical replicates per biological replicate). n.s (non‐significant) (unpaired t‐test).
-
FDot plot represents that the activation of 2C12 NKT hybridoma is not due to cells undergoing apoptosis upon treating the J774.2 cells with thapsigargin. Graphs show mean ± SEM from n = 5 individual mice per condition. n.s (non‐significant) (Mann–Whitney U‐test).
Source data are available online for this figure.