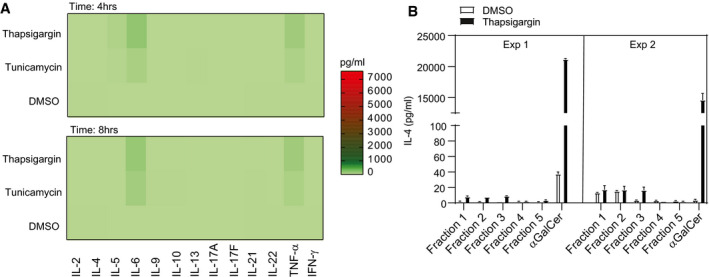
Figure EV2. Autoreactivity of iNKT cells induced by UPR is cytokine‐ and TLR‐independent.

- Heat map (A) represents cytokine secretion by primary murine BMDMs treated with either thapsigargin, tunicamycin or DMSO. Except for IL‐6 and TNF‐α, BMDMs displayed negligible levels of cytokines. Heat map shows the average result of two pooled biological replicates.
- Neutral (Fractions 1–3) and polar lipids (Fractions 4–5) were isolated from murine bone marrow‐derived macrophages stimulated with thapsigargin or DMSO and fractionated using solid‐phase extraction (SPE) cartridges, co‐cultured with purified NKT2 subsets. Bar graph represents IL‐4 release by NKT2 cells by CD1d protein‐bound neutral and polar lipid fractions isolated from thapsigargin (black bars)‐ or DMSO (white bars)‐treated primary murine macrophages. In total, n = 2 biological replicates were performed (two technical replicates per biological replicate). Graphs show mean ± SEM of each biological replicate.
Source data are available online for this figure.
