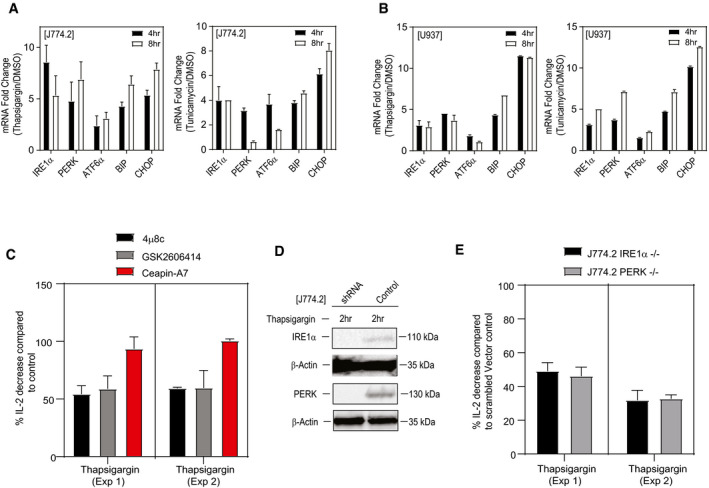
Figure 3. Autoreactivity of iNKT cell requires both the IRE1α and PERK pathway.

-
A, BqPCR analyses showing the expression (fold induction) of UPR signature genes compared to DMSO in murine and human macrophage cell lines, J774.2 (A) and U937 (B) stimulated with either thapsigargin, tunicamycin or DMSO for 4 or 8 h. Graphs show mean ± SEM from n = 2 biological replicates (two technical replicates per biological replicate).
-
CBar graph represents percentage of IL‐2 secretion by NKT cell hybridoma (2C12) co‐cultured with murine macrophage cell line (J774.2) treated with either thapsigargin or tunicamycin in the presence of IRE1α inhibitor (4μ8c) (black bar) or PERK inhibitor (GSK) (grey bar) or ATF6α inhibitor (Ceapin‐A7) (red bar), respectively. Inhibition of IRE1α or PERK resulted in significant reduction in IL‐2 secretion by iNKT hybridoma compared to controls. In total, n = 2 biological replicates were performed (two and four technical replicates per biological replicate, respectively). Graphs show mean ± SEM of each biological replicate.
-
DImmunoblots represent the knockdown efficiency for IRE1α and PERK protein in J774.2 cell line transduced with lentiviral particles carrying gRNA against the IRE1α or PERK gene.
-
EBar graph represents percentage of IL‐2 secretion by NKT cell hybridoma (2C12) co‐cultured with thapsigargin‐treated murine IRE1α or PERK knockdown macrophage cell line (J774.2). Knockdown of IRE1α (black bar) or PERK (grey bar) resulted in significant reduction in IL‐2 secretion by iNKT hybridoma. In total, n = 2 biological replicates were performed (three technical replicates per biological replicate). Graphs show mean ± SEM of each biological replicate.
Source data are available online for this figure.
