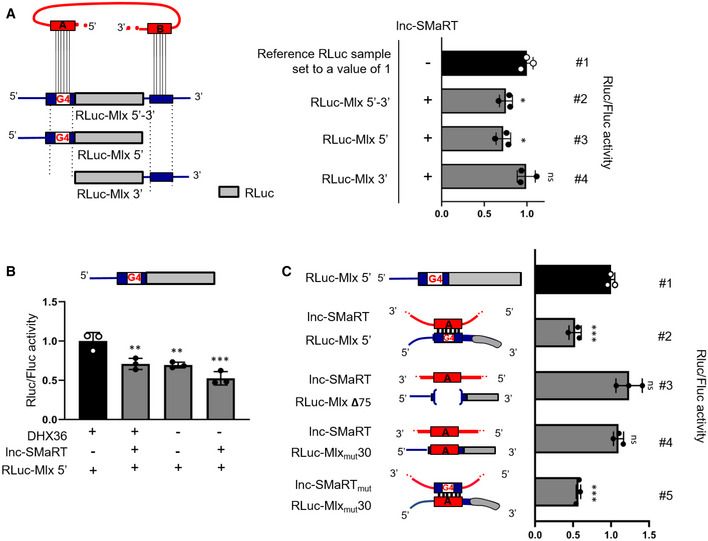
Figure 5. Lnc‐SMaRT controls the translation of Mlx‐γ through direct base pairing with the G4‐containing region.

- Left panel: schematic representation of the luciferase constructs produced for Mlx. Mlx 5′‐ and 3′UTR‐interacting regions were cloned, respectively, upstream and downstream the Renilla luciferase coding region (RLuc‐Mlx 5′‐3′) and mutant derivatives devoid of the 5′ interacting region (RLuc‐Mlx3′) or the 3′ UTR‐interacting region (RLuc‐Mlx5′) were obtained. These constructs were co‐transfected in C2C12 myoblasts in growth conditions together with plasmids expressing lnc‐SMaRT (+) or with a control vector (−). Right panel: Luciferase activity data, presented as the mean ± s.e.m. of three biological replicates (dots), are shown with respect to each RLuc control vector (RLuc‐Mlx 5′–3′, RLuc‐Mlx3′, RLuc‐Mlx5′) set to a value of 1. Statistical analysis was performed with ordinary analysis of variance (ANOVA) followed by Dunnett's multiple comparison test. *P < 0.05.
- The RLuc‐Mlx5′ construct was co‐transfected in N2a cells together with plasmids expressing lnc‐SMaRT (+) or with a control vector (−) and treated with control siRNA (+) or siRNA against DHX36 (−). Luciferase activity data, presented as the mean ± s.e.m. of three biological replicates (dots), are shown with respect to RLuc‐Mlx5′ vector set to a value of 1. Statistical analysis was performed with ordinary analysis of variance (ANOVA) followed by Dunnett's multiple comparison test. **P < 0.01, ***P < 0.001.
- Left panel: schematic representation of the luciferase constructs used. The RLuc‐Mlx5′ construct and its derived mutants (RLuc‐Mlxmut30, RLuc‐Mlx Δ75) were transfected in N2a cells in growth conditions together with lnc‐SMaRT‐expressing plasmids (lnc‐SMaRT) or with its derived mutant (lnc‐SMaRTmut) in the indicated combinations. Right panel: Luciferase activity data, presented as the mean ± s.e.m. of three biological replicates (dots), are shown with respect to each RLuc control vector (RLuc‐Mlx5′, RLuc‐Mlxmut30, RLuc‐Mlx Δ75) set to a value of 1. Statistical analysis was performed with ordinary analysis of variance (ANOVA) followed by Dunnett's multiple comparison test. ***P < 0.001.
Source data are available online for this figure.
