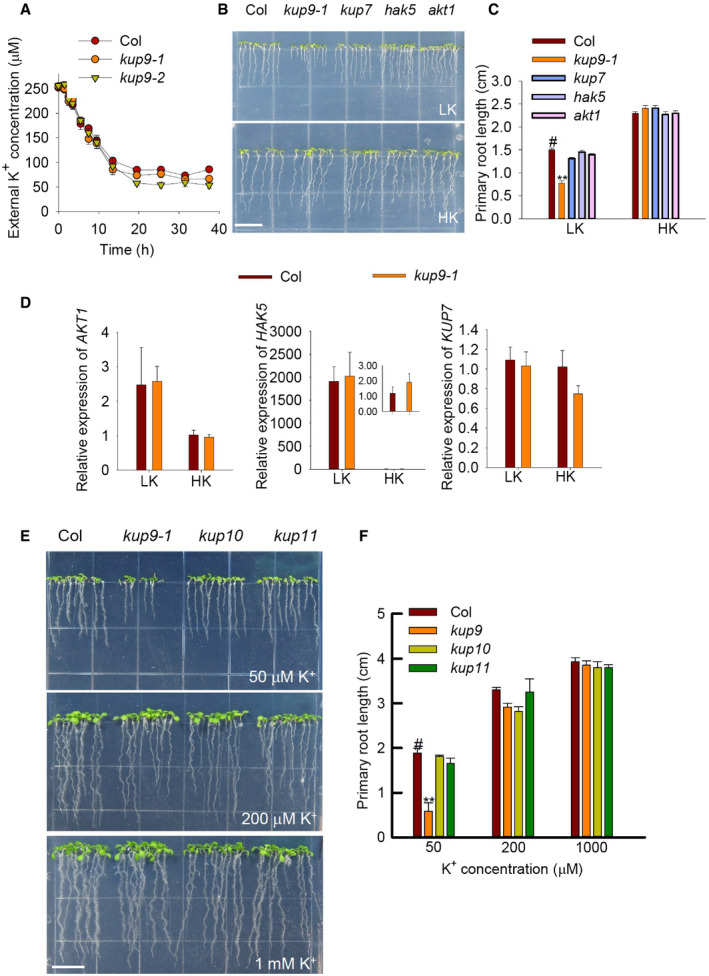
Figure EV2. K+ uptake analyses of kup9 mutants and phenotypes of different K+ transporter mutants under LK conditions.

-
AComparison of K+ uptake capacity among various plant materials using a K+‐depletion experiment. Data are shown as means ± SE (n = 4, biological replicates; each replicate contains 1 g individual plants).
-
B, CPhenotypes and primary root lengths of akt1, hak5, and kup7 mutants. Seeds were germinated and grown on LK or HK medium for 7 days. Data are means ± SE (n = 25, individual plants). Student's t‐test (**P < 0.01) was used to analyze statistical significance, and “#” represents the control. Scale bar, 1 cm in (B).
-
DRT–qPCR analyses of K+‐uptake related genes in wild type and kup9‐1 mutant. Data are shown as means ± SE (n = 3, biological replicates; each replicate contains 120 individual plants).
-
E, FPhenotypes and primary root lengths of kup10 and kup11 mutants. Scale bar, 1 cm in (E). Data are means ± SE (n = 15, individual plants). Student's t‐test (**P < 0.01) was used to analyze statistical significance, and “#” represents the control.
Source data are available online for this figure.
