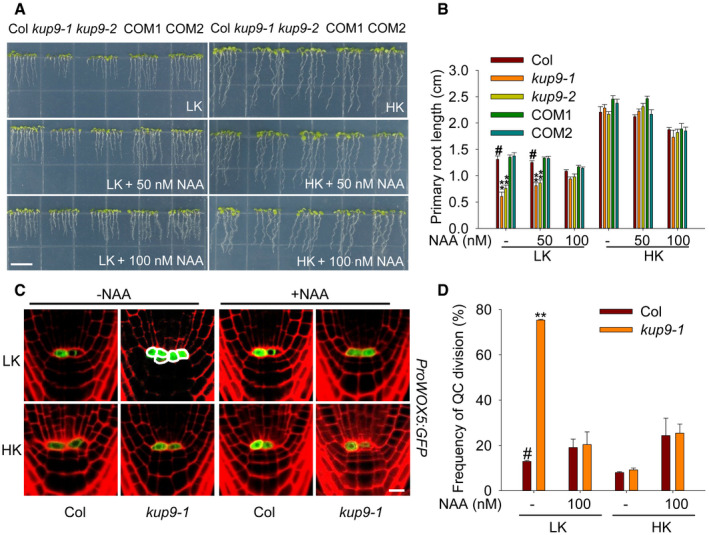
Figure 6. Exogenous auxin rescues the primary root growth and QC activity of kup9 mutants under LK conditions.

- Phenotypes of various plants. Seeds were germinated and grown on LK or HK medium with or without NAA for 7 days. Scale bar, 1 cm.
- Primary root length of the plants tested in (A). Data are means ± SE (n = 25, individual plants). Student's t‐test (**P < 0.01) was used to analyze statistical significance, and “#” represents the control.
- QC cell observation using the QC marker line ProWOX5:GFP. Seeds were germinated on HK medium for 4 days, and then, the seedlings were transferred to LK or HK medium with or without NAA (100 nM) for 96 h. Scale bar, 10 μm.
- QC division rates of the plants tested in (C). The statistical method is described in Materials and Methods. Data are means ± SE (n = 50–60, individual plants). Student's t‐test (**P < 0.01) was used to analyze statistical significance, and “#” represents the control.
Source data are available online for this figure.
