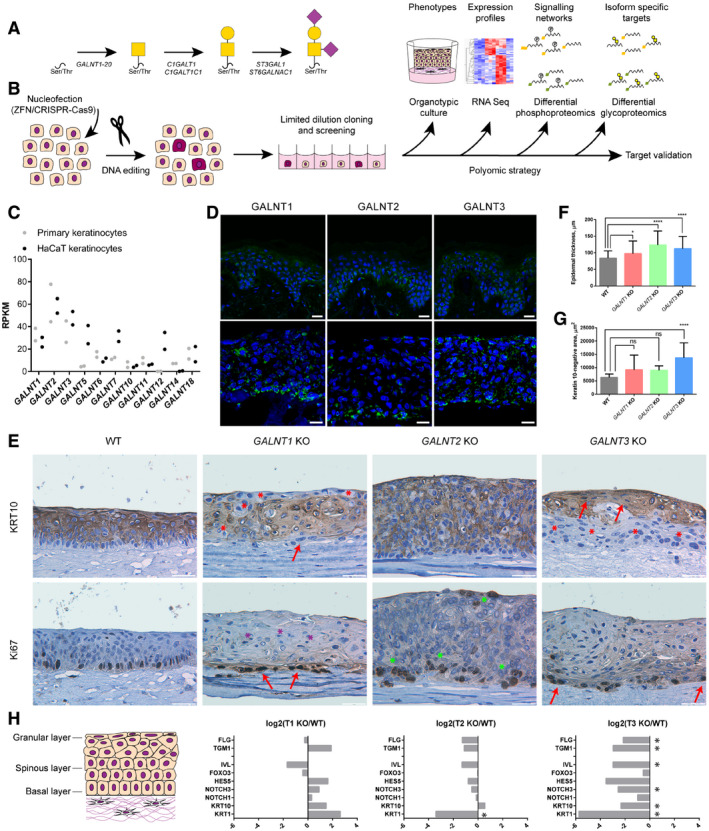
O‐GalNAc‐type O‐glycosylation pathway. Biosynthesis of core 1‐type structures is shown.
Strategy for generation and characterization of GALNT isoform knock outs in HaCaT keratinocytes.
Expression of GALNT isoforms in primary keratinocytes and HaCaT cell line. The scatter plot depicts individual RPKM values of 2 biological replicates.
Expression of GalNAc‐T1, GalNAc‐T2, and GalNAc‐T3 in human skin (upper panel) and HaCaT keratinocyte organoids (lower panel). Frozen human skin or HaCaT keratinocyte organotypic skin models were stained using antibodies for the GalNAc‐T isoforms. Scale bar—25 μm.
Phenotypic characterization of organotypic models made with HaCaT WT or GALNT1/2/3 KO keratinocytes. IHC of tissue sections stained for differentiation marker keratin 10 (upper panel) or proliferation marker Ki67 (lower panel). Scale bar—50 μm. Red arrows—flattened cells; red asterisks—K10‐negative region in suprabasal/granular layers; purple asterisks—pyknotic nuclei; and green asterisks–increase in Ki67‐positive cells.
Quantification of epidermal thickness of skin organotypic models. Epidermal thickness was measured in 5 distinct images (4 positions/image) of 4 clones of GALNT isoform KO or WT (4 different tissues) and is presented as averages +SD. Due to high ZFN KO phenotypic inter‐clonal variation and to exclude off target effects, 5 clones of ZFN and 3 clones of CRISPR KO (each targeted by a different gRNA) were used for GALNT3 KO. ANOVA followed by Dunnet's multiple comparison test was used to compare mean epidermal thicknesses of different KOs to WT. *P ≤ 0.05; ****P ≤ 0.0001.
Quantification of keratin 10‐negative area in skin organotypic tissue sections. Keratin 10‐negative area was measured in 5 distinct images of 4 clones of GALNT isoform KO or WT (4 different tissues) and is presented as averages +SD. Due to high ZFN KO phenotypic inter‐clonal variation and to exclude off target effects, 5 clones of ZFN and 3 clones of CRISPR KO (each targeted by a different gRNA) were used for GALNT3 KO. ANOVA followed by Dunnet's multiple comparison test was used to compare mean areas of different KOs to WT. ****P ≤ 0.0001.
RNAseq expression data of select differentiation markers, expressed in spinous and granular layers of the epidermis (cartoon). Expression data are presented as log2(average KO/average WT). Significantly changed transcripts, identified in R analysis, are marked with asterisks.

