
Figure 2. Phosphoproteomic analysis.
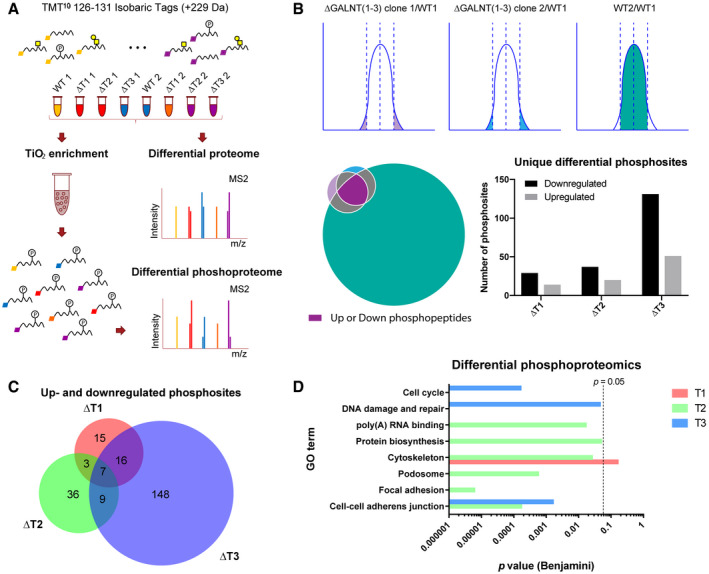
- Strategy for differential phosphoproteomics of HaCaT GALNT KO cell lines, where the Gaussian distributions and the Venn diagram represent selection criteria.
- Analysis of differentially phosphorylated peptides. Upregulated or downregulated phosphopeptides in GALNT KOs were considered significant, if phosphopeptides were identified in both clones more than 2× SD away from the median, and given the same phosphopeptides were within the normal variation of two wild‐type biological replicates. The Venn diagram illustrates the selection criteria, where the color scheme corresponds to the Gaussian distribution illustration above. The bar graph depicts numbers of unique differential phosphosites in the individual GALNT KOs.
- The Venn diagram represents overlap between differential phosphosites identified in the different GALNT isoform KOs.
- GO terms (DAVID) associated with phosphoproteins identified in the 3 differential datasets. P value (Benjamini multiple comparison adjusted) of 0.05 is marked with a dashed line.