-
A–D
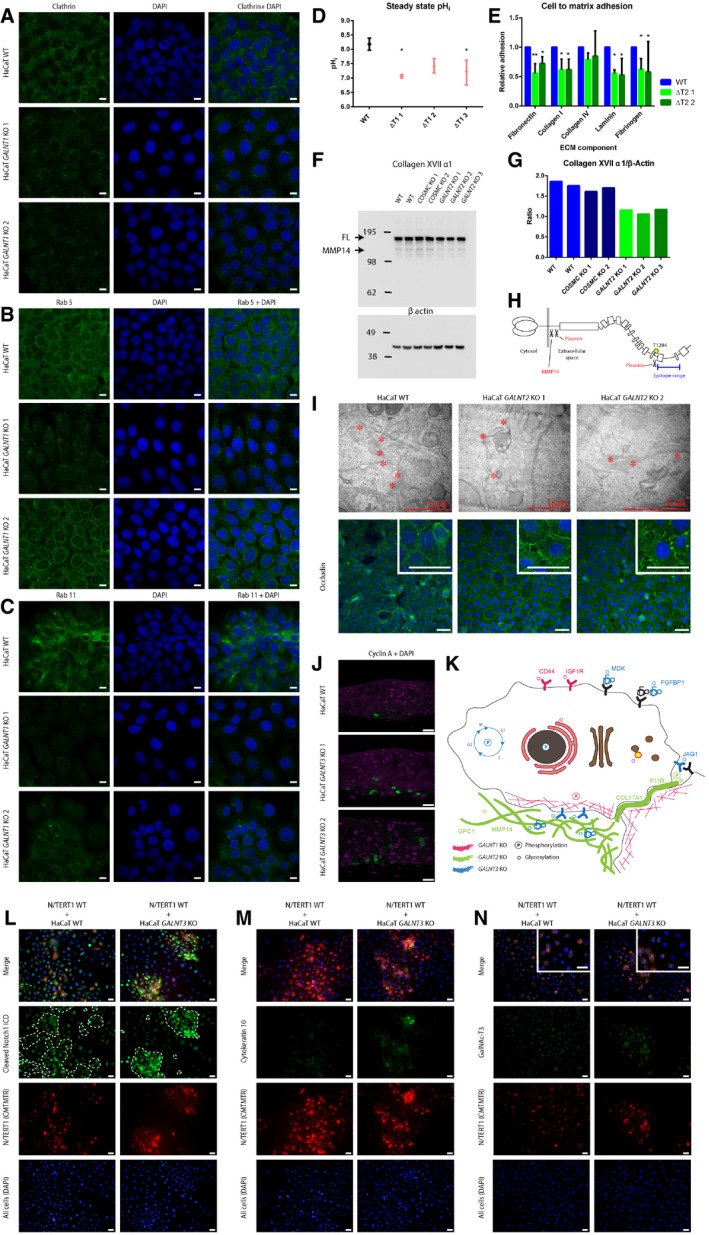
GalNAc‐T1 affects the organization and function of the endomembrane system. HaCaT WT and GALNT1 KO cells were stained for intracellular trafficking markers (scale bar—10 μm). (A) Clathrin; (B) Rab5; and (C) Rab11. (D) Steady‐state intracellular pH measurement in in HaCaT WT and GALNT1 KO cells. Data are presented as average ± SD of 2 independent experiments. ANOVA followed by Dunnet's multiple comparison test was used to compare mean intracellular pH of three different clones of GALNT1 KOs to WT. *P ≤ 0.05.
-
E
GalNAc‐T2 is important for cell to matrix adhesion. HaCaT WT and GALNT2 KO cells were used in a cell to matrix adhesion assay using plates coated with different ECM components. Data are presented as average + SD of three independent experiments and are normalized to WT. ANOVA followed by Dunnet's multiple comparison test was used to compare mean relative adhesion of two different clones of GALNT2 KOs to WT. *P ≤ 0.05; **P ≤ 0.01.
-
F
Western blot for GalNAc‐T2‐specific target and hemidesmosome component COL17A1.
-
G
Quantification of Western blot bands for COL17A1 (full length) normalized to β actin.
-
H
Depiction of COL17A1 protein, including position of GalNAc‐T2‐specific O‐glycosite and proteolytic processing sites.
-
I
GalNAc‐T2 may affect tight junction formation and integrity. Upper panel, TEM of WT and GALNT2 KO organotypic tissue sections, where tight junctions are marked with asterisks. Lower panel, IF staining of WT and GALNT2 KO for tight junction marker occludin (scale bar—50 μm). Inserts depict 3× zoomed in partial images (scale bar—50 μm).
-
J
Expression of cyclin A (green) in HaCaT WT and GALNT3 KO organotypic tissue, visualized by IF (scale bar—20 μm).
-
K
The cartoon summarizes the effects of individual GALNT isoform KOs on signaling networks and subcellular location of protein substrates based on differential phosphoproteomic and O‐glycoproteomic analyses.
-
L–N
Co‐culture of HaCaT WT or GALNT3 KO keratinocytes with N/TERT1 keratinocytes induces cellular differentiation. Cells co‐cultured on coverslips were stained for cleaved Notch 1 intracellular domain (L), cytokeratin 10 (M), or GalNAc‐T3 (N; inserts depict 2× zoomed in partial images (scale bar—20 μm)). Green—relevant staining, red—N/TERT1 cells (labeled with CMTMTR), and blue—DAPI, scale bar—20 μm. Boundaries between HaCaT and N/TERT‐1 cells in the green panel of (L) are marked with a dashed line.

