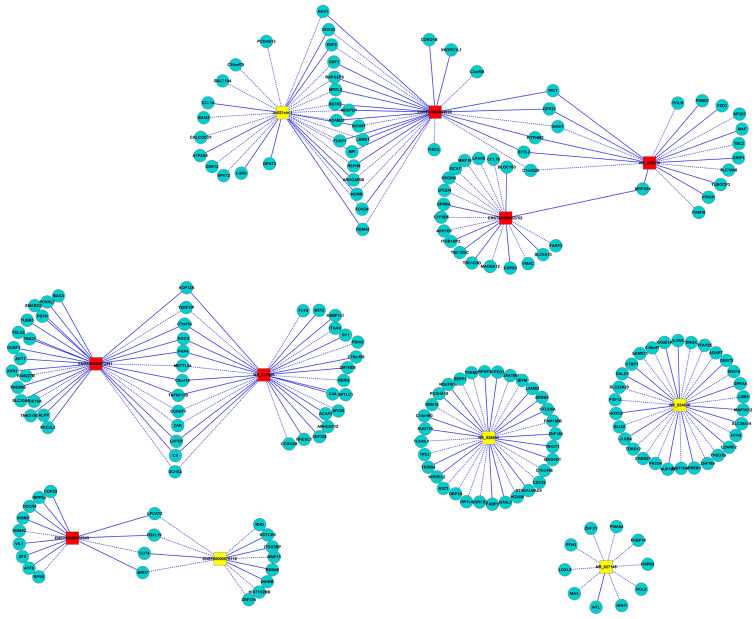
Figure 6.
Co-expression network of differentially expressed lncRNAs and mRNAs. The blue circular nodes represent coding genes; the red square nodes represent upregulated non-coding lncRNAs; the yellow square nodes represent downregulated non-coding mRNAs; solid lines between two nodes represent a positive correlation and dashed lines represent a negative correlation. lncRNA, long non-coding RNA.

