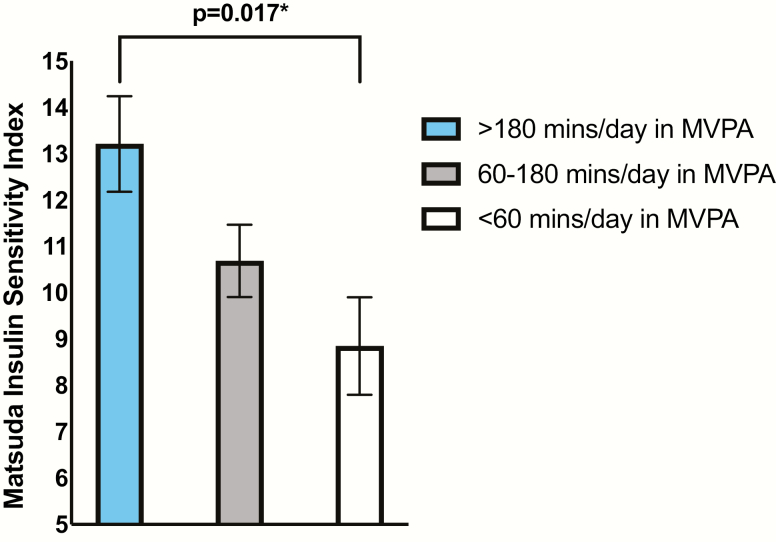
Figure 1.
LSmeans of insulin sensitivity by terciles of moderate to vigorous physical activity. Visual demonstration of the significant relationship between the ISI and time spent in MVPA. Adjusted for child age, sex, dietary added sugar, daily EI, maternal prepregnancy BMI, GDM status, and child BMI z-score. *Denotes P-value < 0.05.

