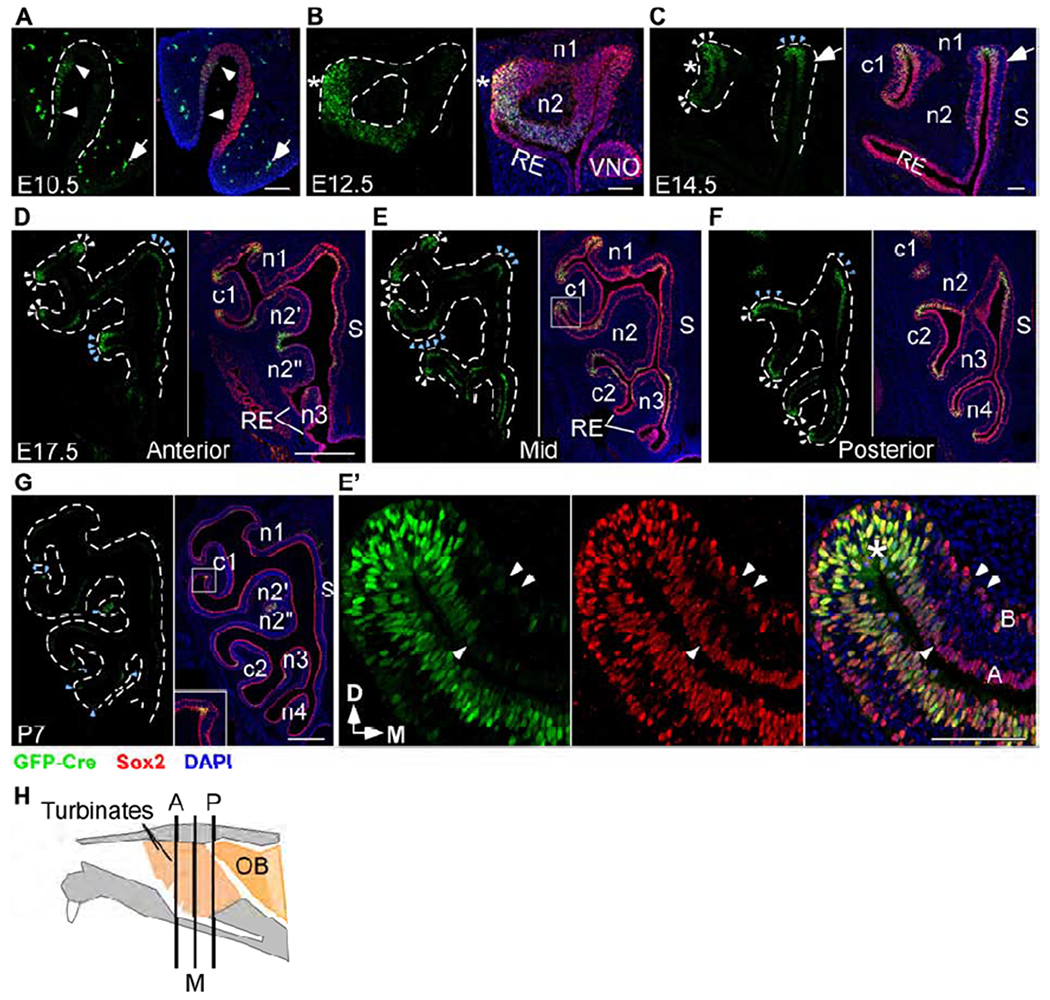
Figure 1.

Fgf20 is expressed in a subset of Sox2+ cells in the developing OE
(A-G) Fgf20 expression detected via an anti-GFP antibody in Fgf20GFP-Cre/+ mice (green). The OE is identified via an anti-Sox2 antibody (red). Sox2 is expressed throughout the OE at E10.5 (A) and E12.5 (B), and mainly in the basal and apical layers at E14.5 (C), E17.5 (D-F), and P7 (G).
(A) Faint Fgf20GFP-Cre expression in the nasal pit at E10.5. Arrowheads indicate extent of the expression. Arrow indicates autofluorescence from red blood cells outside of the nasal pit.
(B) Fgf20GFP-Cre expression in the OE at E12.5. * indicates site of future c1 development. VNO, vomeronasal organ.
(C) Fgf20GFP-Cre expression in the OE at E14.5. White arrowheads indicate immature negatively-curved OE. Blue arrowheads indicate mature negatively-curved OE. Arrows indicate apical Fgf20 expression in OE outside of regions of negative curvature. * indicates expression in OE overlying c1.
(D-F) Fgf20GFP-Cre expression in anterior (D), mid (E), and posterior (F) sections at E17.5. White arrowheads indicate immature negatively-curved OE. Blue arrowheads indicate mature negatively-curved OE.
(E’) Magnification of the c1 neck region, boxed in (E). Arrowheads indicate fainter Fgf20GFP-Cre expression in Sox2+ basal and apical cells adjacent to negatively-curved OE (*). A, apical layer; B, basal layer indicated in the merged image.
(G) Fgf20GFP-Cre expression at P7. Arrowheads indicate apical Fgf20GFP-Cre expression at negatively-curved OE. Inset, 2.5x magnification of boxed region.
(H) Diagram of a mid-sagittal mouse nasal cavity showing locations of the three sections in (D-F). A, anterior; M, mid; P, posterior.
RE, respiratory epithelium. S, nasal septum. D, dorsal; M, medial. Dashed line, epithelial-mesenchymal boundary. DAPI, nuclei (blue). Scale bars, 100 μm (A-C, E’), 500 μm (D-G). See also Figure S1.
