Figure 2.

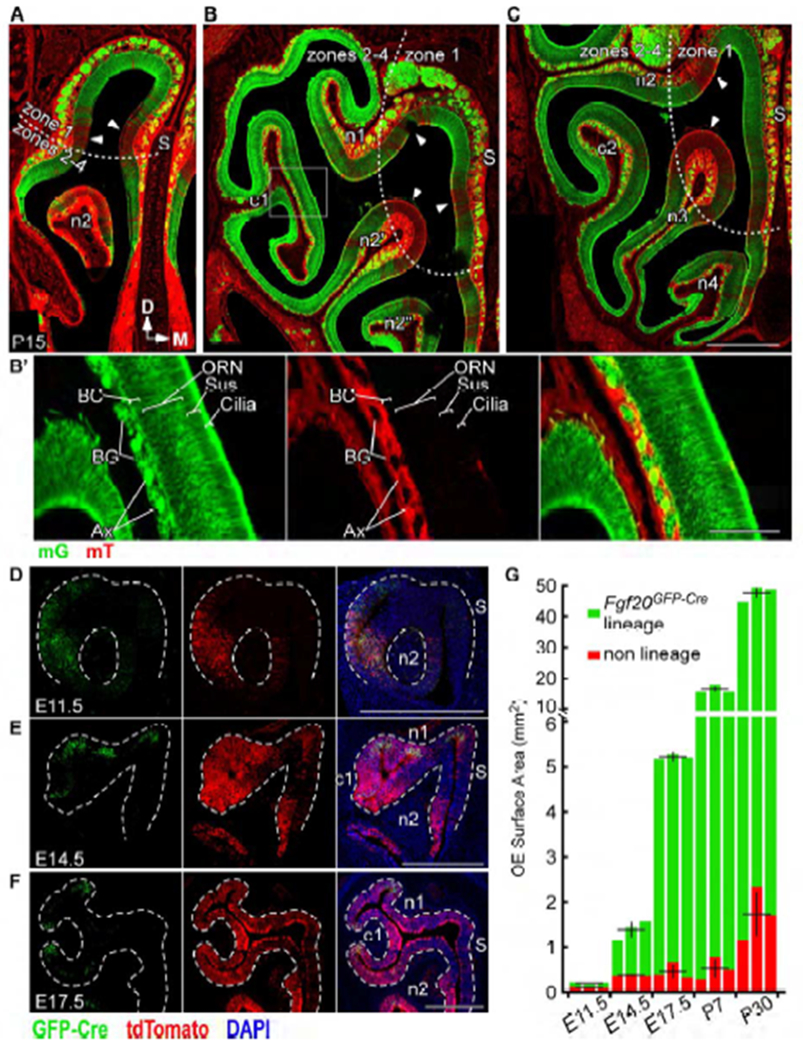
Fgf20 lineage includes all major OE cell types and responds to cues for expansion
(A-C) mG expression in the Fgf20GFP-Cre lineage and mT expression (arrowheads) in non-Fgf20GFP-Cre lineage in anterior (A), mid (B), and posterior (C) frontal sections of Fgf20GFP-Cre/+; ROSAmTmG mice at P15. S, nasal septum. Dotted line, zone 1 and zones 2-4 demarcation.
(B’) Magnification of boxed region in (B). mG expression in the basal cell (BC), olfactory receptor neuron (ORN), sustentacular cell (Sus), and cilia layers of the OE, as well as in axon bundles (Ax) and Bowman’s glands (BG) found in the lamina propria.
(D-F) Real-time Fgf20 expression (GFP-Cre) and Fgf20GFP-Cre lineage (tdTomato) in Fgf20GFP-Cre/+; ROSAtdTomato mice at E11.5 (D), E14.5 (E), and E17.5 (F). Dashed line, epithelial-mesenchymal boundary.
(G) Quantification of total Fgf20GFP-Cre lineage and non-Fgf20GFP-Cre lineage OE surface area at E11.5, E14.5, E17.5, P7, and P30. Error bars, mean ± SD; n = 3 at each stage; each bar represents one mouse
DAPI, nuclei. Scale bars, 500 μm (A-F), 100 μm (B’). See also Figure S2.
