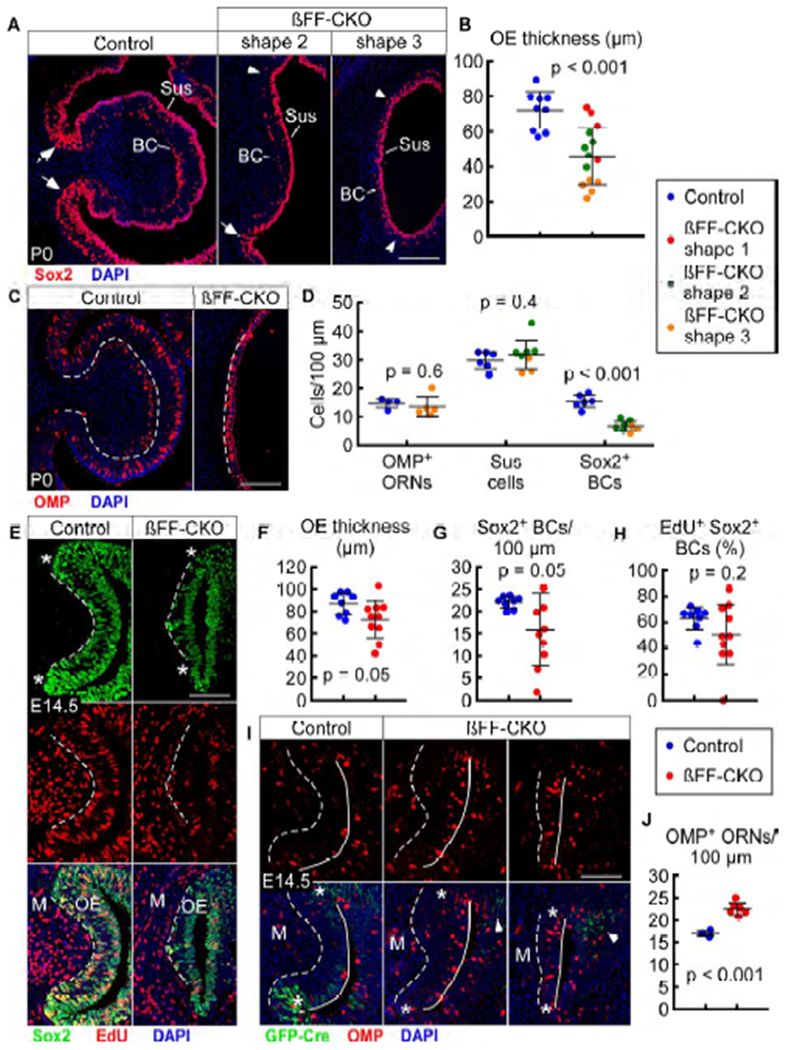
Figure 6.

βCat conditional deletion leads to premature differentiation and progenitor depletion in the OE
(A) Sox2 expression in c1 of control (Fgf20GFP-Cre/+; βCatfl(ex2-6)/+) and βFF-CKO (Fgf20GFP-Cre/+; βCatfl(ex2-6)/fl(ex2-6)) mice at P0, with two phenotype examples (shapes 2 and 3). Arrows indicate presence of FEP cells in control and the less severe βFF-CKO phenotype. Arrowheads indicate absence of FEP cells in the severe βFF-CKO phenotype. BC, basal cells; Sus, sustentacular cells.
(B) Quantification of c1 OE thickness at P0. βFF-CKO phenotype categorized into three shapes (1, 2, and 3). n = 9 control, 14 βFF-CKO, Welch’s t-test.
(C) OMP expression in c1 at P0.
(D) Quantification of c1 OMP+ ORNs (n = 4 control, 5 βFF-CKO), Sus cells (n = 6 control, 8 βFF-CKO), and Sox2+ BCs (n = 6 control, 8 βFF-CKO) per 100 μm OE at P0. βFF-CKO phenotype categorized into two shapes (2 and 3). Welch’s t-test.
(E) EdU incorporation in c1 Sox2+ cells at E14.5. * indicates “neck” region. M, mesenchyme.
(F-H) Quantification of c1 OE thickness (H), Sox2+ BCs per 100 μm OE (F), and percent of EdU-incorporating Sox2+ BCs (G) at E14.5. n = 8 control, 10 βFF-CKO, Welch’s t-test.
(I) Fgf20GFP-Cre and OMP expression in c1 at E14.5, with two βFF-CKO phenotype examples. * indicates “neck” region. Arrowheads indicate Fgf20 expression in n1 and n2 OE. M, mesenchyme.
(J) Quantification of c1 OMP+ ORNs per 100 μm OE at E14.5. n = 3 control, 6 βFF-CKO, Welch’s t-test.
Dashed line, epithelial-mesenchymal boundary. Solid line, OE apical surface. DAPI, nuclei. Scale bars, 100 μm. Error bars, mean ± SD. See also Figure S6.
