
Figure 3. Homo- and Heterodimerization Propensities of mGluR2 with Other mGluR Subtypes.
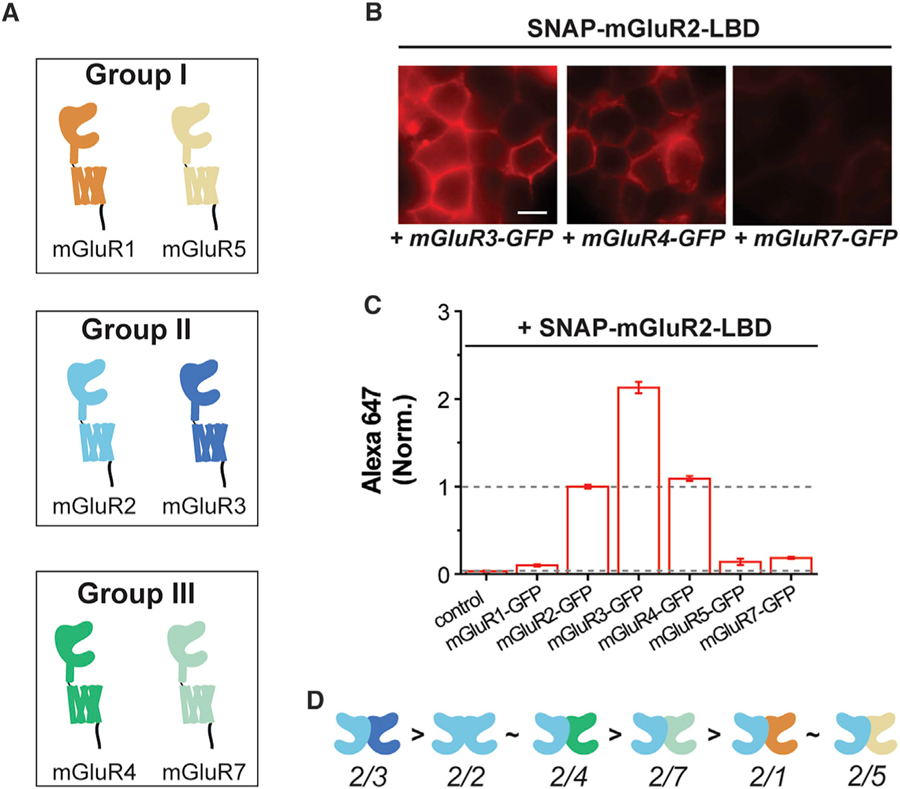
(A) Schematic showing group-I, -II, and -III mGluR subtypes tested in the LBD complementation assay.
(B) Cell images showing SNAP-mGluR2-LBD labeled with Alexa647 when co-expressed with mGluR3-GFP, mGluR4-GFP, or mGluR7-GFP (from left to right). All images are shown on the same fluorescence intensity scale. Scale bar, 10 µm.
(C) Quantification of Alexa647 fluorescence intensity when SNAP-mGluR2-LBD is co-expressed with other mGluR subtypes. Intensity values are normalized to the mGluR2/2 homodimerization condition and data are represented as mean ± SEM.
(D) Schematics showing the relative homo- and heterodimerization propensities of mGluR2.