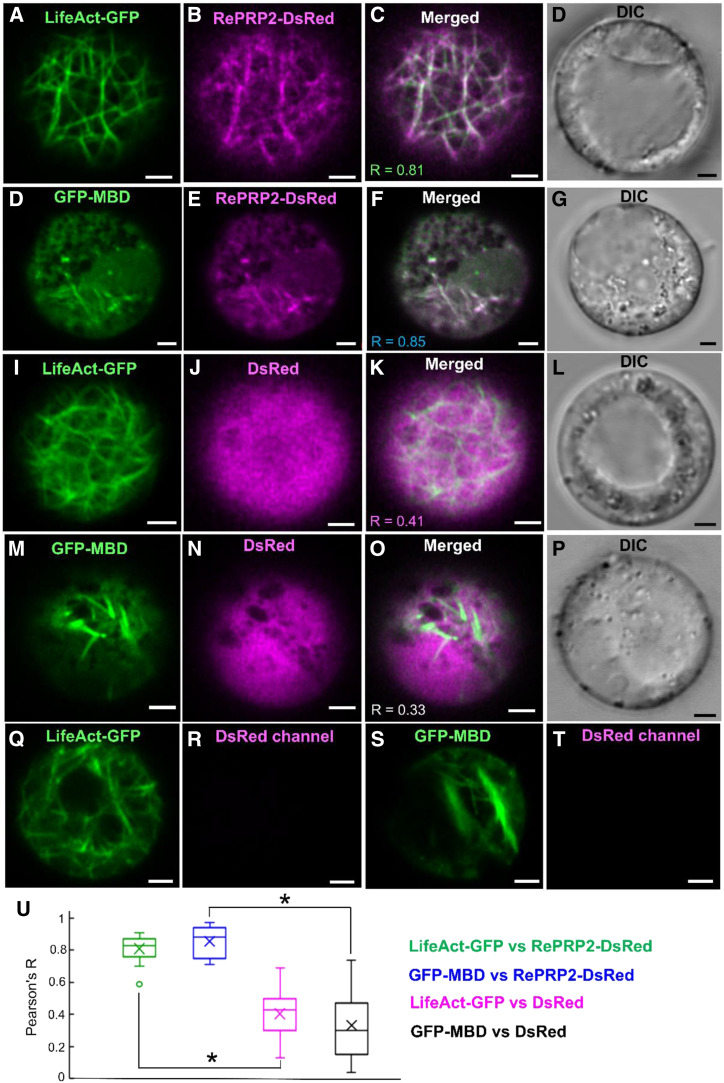
Figure 2.
Interactions between OsRePRP2 and actin and tubulin in rice root protoplasts. A to P, Five-day-old wild-type rice root protoplasts coexpressing LifeAct-GFP and OsRePRP2-DsRed (A–D), GFP-MBD and OsRePRP2-DsRed (E–H), LifeAct-GFP and DsRed (I–L), and GFP-MBD and DsRed (M–P). GFP and DsRed signals are shown in green (A, E, I, and M) and magenta (B, F, J, and N), respectively; overlays of green and red channels (C, G, K, and O) and the DIC channel indicating bright-field images (D, H, L, and P) are also shown. Q to T, Five-day-old wild-type rice root protoplasts expressing LifeAct-GFP (Q and R) and GFP-MBD (S and T). GFP signals are shown in green (Q and S), whereas the DsRed signal in the respective control images is not visible (R and T). Scale bars = 2 μm. U, The Pearson's R correlation coefficients calculated by Pearson coefficient analysis are shown in a box plot. Pearson's R coefficients for LifeAct-GFP and OsRePRP2-DsRed, GFP-MBD and OsRePRP2-DsRed, LifeAct-GFP and DsRed, and GFP-MBD and DsRed are shown in green, blue, magenta, and black boxes, respectively. The line inside the box indicates the median and the ex indicates the mean. Bottom and top box edges are the 25th to 75th percentiles; whiskers indicate the range, and an outlying data point is shown as a circle. Significant differences are indicated with asterisks (P < 0.01, two-tailed Mann-Whitney U test). Data are measured from 15 protoplasts of three biological experiments. The Pearson's R correlation coefficient for each comparison is shown in C, G, K, and O.

