Figure 3.
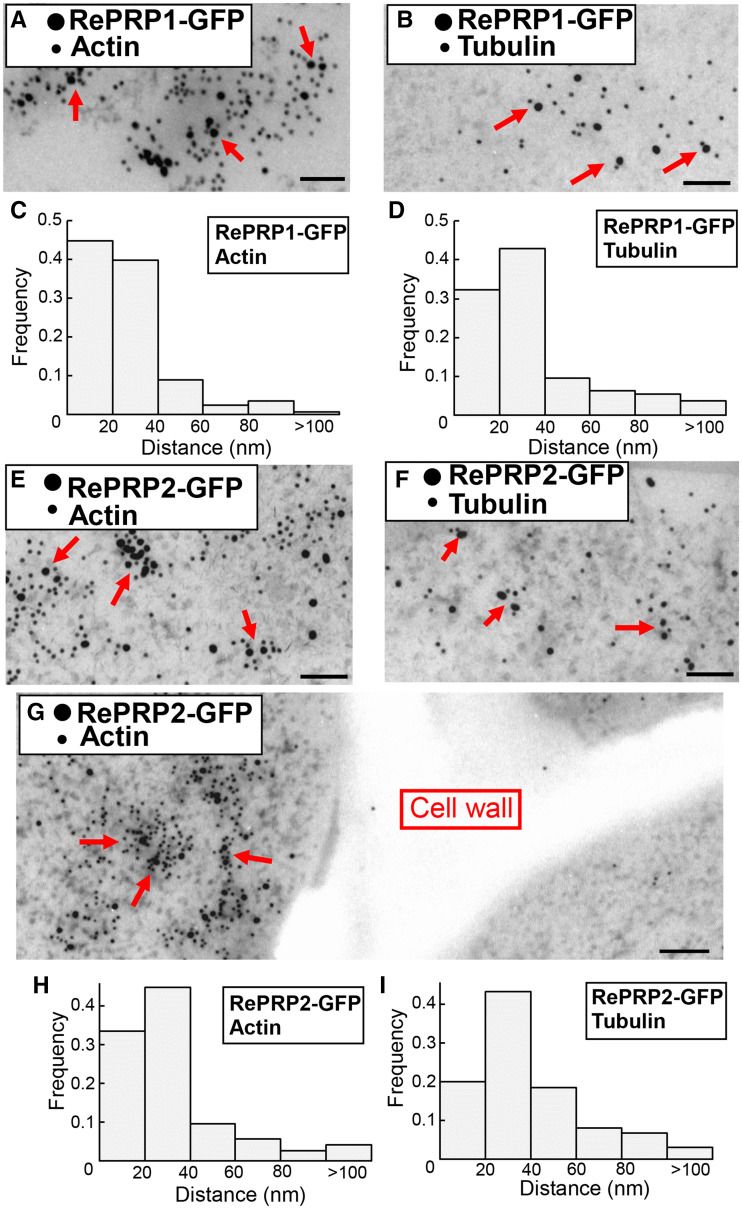
Interactions between OsRePRP and actin and tubulin in planta. A, B, and E–G, Double immunogold-labeling TEM of root elongation zone cells of 3-d-old OsRePRP1-GFP (A and B) and OsRePRP2-GFP (E–G) rice. The smaller 12-nm gold particles represent the distribution of actin (A, E, and G) and tubulin (B and F), and the larger 18-nm gold particles represent the distribution of OsRePRP1-GFP (A and B) and OsRePRP2-GFP (E–G). Arrows indicate colocalization of OsRePRP-GFP and actin (A, E, and G) or tubulin (B and F). Scale bars = 100 nm. C, D, H, and I, Distances from each OsRePRP-GFP gold particle to the closest actin or tubulin gold particle were measured as described in "Materials and Methods." The bars represent the distribution of center-to-center distances between gold particles in OsRePRP-GFP and actin or tubulin, ranging from 0 to >100 nm. Ten images were measured, and two biological replicates were performed.

